The accounting representation of Tech companies is key to understanding their value. Only if you dig deep enough can you appreciate their fair value, and being a conservative Tech investor is not easy. Value investors are usually unwilling to pay for growth, and finding a tech stock where growth is not priced in is a rare beast or a value trap.
Asset protection is hard to assess because Tech companies are asset-light and intangible, and Goodwill represents most of their assets. One needs to be skillful in recreating an adjusted asset valuation to understand the true essence of the balance sheet.
Why would any analyst be worried about recreating an adjusted balance sheet of a tech company? That’s what a fundamental value investor should do, and in this article, we discuss why while applying this concept to this very debated company.
In this article, we are going to:
- Recreate a conservative Asset value for META (META) to compare it to its EPV (Earning Power Value).
- Compute EPV calculation.
- Explain why META is undervalued even when considering all the investment in reality labs as lost with zero growth priced in the valuation
- Conclude that from its current price, there is a limited downside possibility, and multiple are so compressed that any easing of the micro conditions or small improvements of margins or revenue could drive META to outperform the market.
Why EPV?
Earnings Power Value is a measure of sustainable earnings used often by Proof. Greenwald at Columbia University is a proxy for putting in perpetuity at WACC a company’s sustainable earnings, smoothing out revenue and margin that are not considered within the norm, mostly averaging them after understanding the firm’s typical cycle.
We have previously employed the value investing framework in assessing companies like Silvana or Menzies, and for both, we exit at more than 100% gain, but publicly until now, we haven’t analyzed a tech company using a value approach; we intend to try now with META (META) since among the FAANG it seems the one where the market is discounting the worse possible scenario.
Only once we have assessed that a company is able to produce superior returns, meaning that having capitalized sustainable earnings which are superior to its asset value, we can dig further to verify that the company enjoys barriers to entry. Therefore we can analyze what is called franchisee value, which is the ability to generate higher returns on invested capital over its cost of capital.
That’s what Munger calls a “great business for a fair price” When he refers to the importance of a business having a MOAT and the ability to compound returns at a rate higher than WACC. How much to pay for its growth is a key metric in buying a great business without losing sight of a realistic valuation.
Asset Value of META
Starting with asset valuation, some of you might think that asset valuation does not have any meaning for tech companies, but it does provide the opportunity to verify the essence of the moat when compared with their sustainable earnings.
Let’s take a glance at the balance sheet. It’s not a surprise to see how low leveraged META is, with an asset value, according to the last available statement, of $179b and an equity value of $124b, with only $55b in liabilities, including $16b of accrued expenses. If we look at the goodwill amount, it is about $20b, which includes amounts related to the acquisition of Instagram, WhatsApp, Oculus, and other smaller firms.
So, meta reports its revenues into two segments: Family of Apps and Reality Labs. With the latter, the main issue is $10b “lost” in 2021, and only last quarter loss of $3.6b, and Zuckerberg does not seem to be interested in stopping this, which some value investors are calling a bloodbath.
The Reality Labs’ issue is the key to understanding META’s stock price crises. Realty Labs’ cost is dramatically increasing, the operative cost was 3.95 billion, and its trend has been up north of 50% in the last year, and it shows no sign of coming down. The table below highlights the breakdown of revenue and operating income between the family of apps and Reality Labs.

This investment is, as we know, far from becoming profitable. All of you that came across the famous Christensen book “The Innovation Dilemma” perfectly understand META’s current stage and the main problem of its founder.
A company at this stage could become a cash cow, in which the management could concentrate on returning shareholder value through buyback and improving cost efficiency. However, this does not come as a free lunch. Indeed, it comes at the expense of the company’s future growth, which would no longer be there. Instead, investing in growth and new opportunities for new markets would allow the company to try not to get disrupted by other companies in the future. Money spent on growth would eventually come back as a new stream of free cash flow. At least in theory, and only if the company can produce and sell a meaningful, useful product.
In META’s reported intangibles, the most important part, the internally generated ones, are missing. The internal product portfolio, software, internal technologies, and platform that METAS has. And the customer portfolio, the billions of people participating in the network that every day log into those platforms to interact. Also, the workforce, engineers, marketing staff, and executives who generate value for the company.
We believe that the valuation of intangibles is the only way to assess the profitability of the company and the possibility that this company can convert investments in research and development into streams of future cash flow.
Assessing Asset Value
To assess those missing internal intangibles, we will proceed as follows.
First, we are going to use a perpetual inventory model to assess the product portfolio, then we will assess the customer portfolio by using the reproduction cost framework, and lastly, we will assess the cost of rehiring the workforce and capitalize on it.
For the workforce, we take the general administrative expenses for the year of $9.9 billion and divide them by 76,000 employees (after firing 11k just a few weeks ago). At this point, the average salary for employees would be 130,000, and we would assume 15% of the headhunting fee in general, which would be a value of roughly $2.5 Billion for the workforce.

The capitalization of the R&D in the product portfolio is not reported, and we want to be conservative and assume that all the money of realty labs would be lost. So, let’s assume that a depreciation of 20% starts from 2014. We are going to use the perpetual inventory method. So, looking at this, we will cut by much the reported R&D and only use the one without realty labs cost.
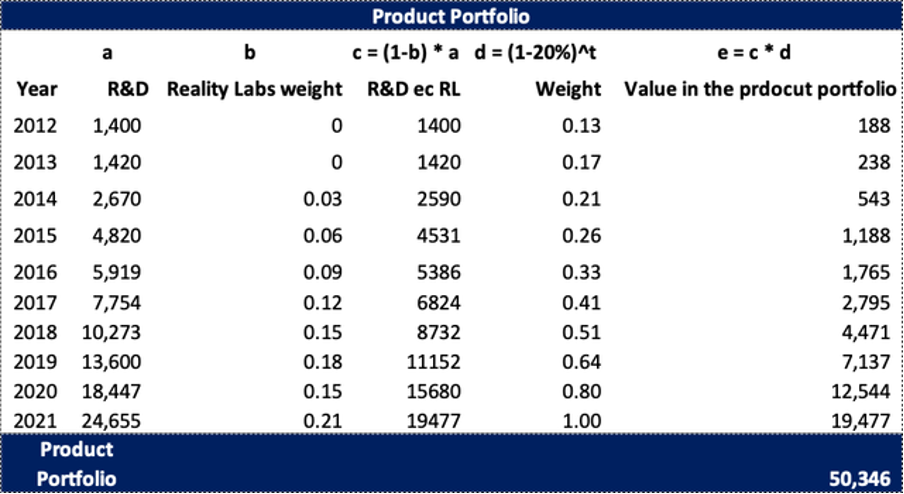
Research and development expenses are the costs spent on developing new products and keeping old products up to date. The classical or maintenance CAPEX is included in these expenses, which is a very important distinction to assess to separate the maintenance costs from the Growth CAPEX.
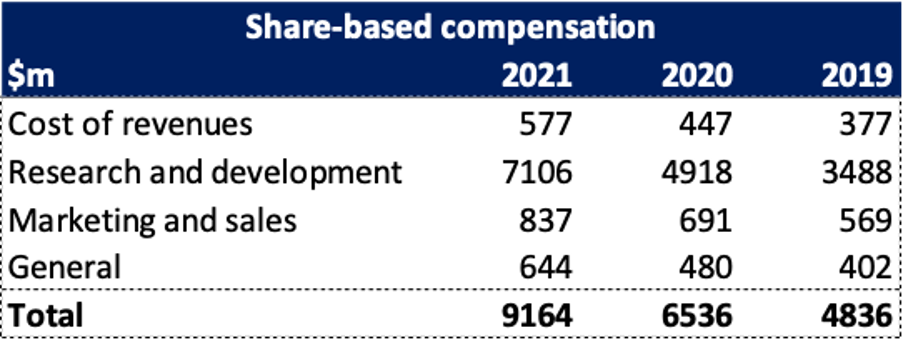
25% of those costs in R&D are based on stock compensation, which is typical of some tech companies, so dilution does happen all the time to pay for this compensation. However, Meta has been buying back, as we know, many shares, but it’s important to assess the real net value of the buying, also considering the dilution in place, to understand if the buyback is a way for the executives to sell their stocks or it would be a way to drive shareholder value.
Sometimes, people tend to jump quickly to conclusions on buybacks. Yes, they could be a great way to create shareholder value if the company does not keep diluting from the other side to compensate its team.
For reference, the table below highlights the cost related to share-based compensation for the past three years.
The second most important factor is the customer portfolio. We will be highlighting both of our models to calculate it for the understanding of our audience.
Traditionally the model we use is based on some assumptions.
The number of customers acquired during the fiscal year is linear based on the money spent on sales and marketing expenses.
The rate of customers acquired per dollar spent on sales and marketing decreases over time (it cost more to acquire the last client than the first one).
Starting from the formula of the customer:
C(T) = (1-a) * C(t-1) + B(T) * i(T)
The customer today C(T) is just the customer of yesterday C(t-1) less the churn rate (1-a) plus the money spent on marketing i(T) multiplied by how much spent in dollars terms convert into customers B(T).
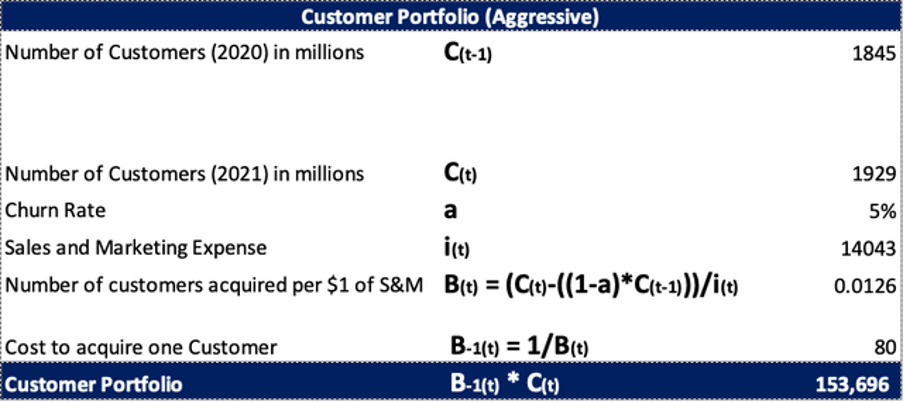
We are assuming a churn rate of 5%, which is the rate at which Meta loses customers every year. For a number of customers, we are using the daily active users (DAU) that Meta reports in their annual reports.
From this, we rearrange to get the B(T) value:
B(T) = (C(T) – ((1-a)*C(t-1))) / i(T)
As we can see, the number of customers obtained for each dollar spent is the customers today minus those who are left after one year, divided by the money spent on sales and marketing.
So, the goal is to find how much a customer costs to be acquired B-1(T), which is the inverse of B(T), and then multiply that by the number of customers to get the customer portfolio, which obviously is not contemplated in the balance sheet.
From the above methodology, the value of the customer base would be m$153,696. Calculations are highlighted in the table below.
Since we are being very conservative with META’s valuation, it only makes sense to use a conservative model for the customer base too.
In that model, we first calculate the sum of how much the company invests each period to increase the customer base (IC) for several years and then add that amount to some base period to get the value of the customer base (VCB).
Our conservative estimation of the customer portfolio is shown in the table below, which gives us a value of $58,871m.

So, let’s readjust the asset value to include the missing intangibles we have calculated above. There is one more adjustment that we will make, which is to adjust Goodwill to avoid double counting.
We only want to keep the Goodwill of the brands that still have a separate brand identity, like WhatsApp or Instagram. Since Oculus is now fully integrated with the Meta brand, we would remove the part of Goodwill which was acquired due to Oculus’s acquisition.
Asset Value Calculation
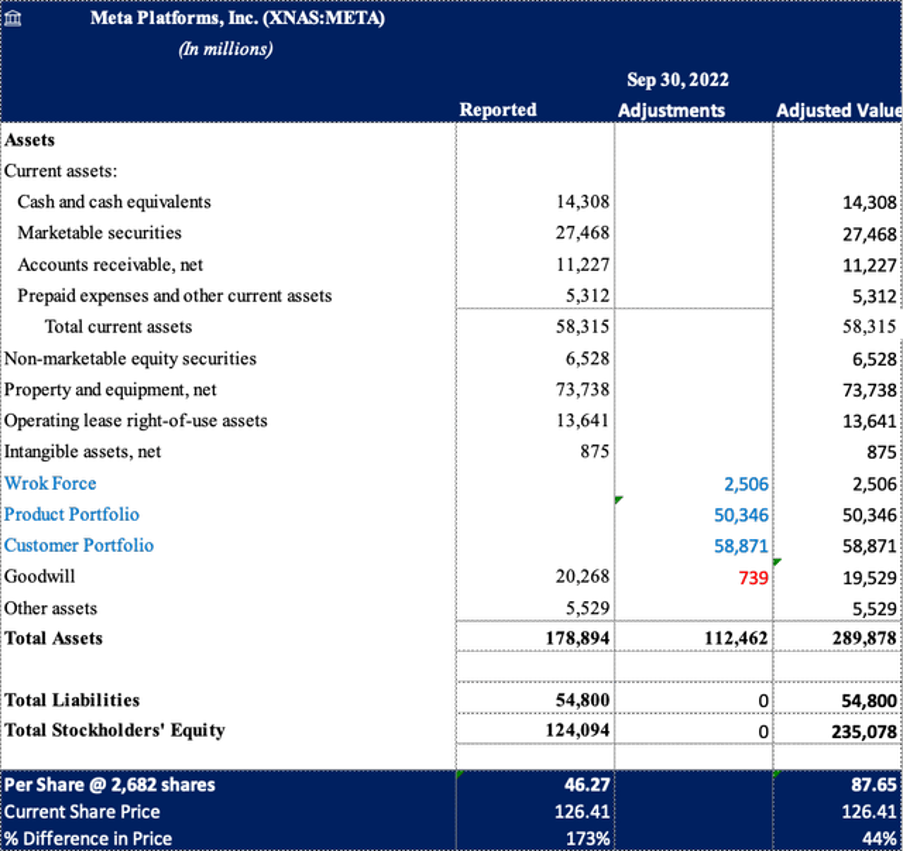
The adjusted asset value we get is $235,078b. We will next calculate the earnings power value (EPV) and compare it with the asset value to identify whether Meta has an economic moat or not.
Earnings Power Value Assessment
We have a revenue estimate, which is lower than the last financial year, so not only are we not accounting for the growth of revenue, we are conservatively reducing the revenue to $105 Billion, which is lower by roughly 11% YoY.
We also use a very conservative margin of 27%, which is much lower than the historical one, close to 40%, also accounting for the huge R&D expenses in realty labs and reels and AI which the company is facing, and they might persist longer.
At this point, we must consider the growth CAPEX related to product and customer portfolios.
If we use the same amortization rate of 20% for a product portfolio worth 50 billion, that will be 10 billion depreciation, intended to be the amount we need for the maintenance CAPEX of the software. To find the growth part, we will deduct the maintenance expense from the total expense of RnD ex Realty labs of $19.4 billion, the total growth part would be around $9.4 Billion.

This is an assumption; of course, we need to believe the 9.4 billion spent on reels, AI, etc., would eventually not be lost. However, at this stage, we do find that to be the case.
In order to understand the growth part related to the customer portfolio we have to calculate the maintenance CAPEX, so it will be the cost of acquiring a client B-1(T) of 100$, multiplied by the 5% churn rate multiply the number of customers of 1.9 bill, so total = 9.6Billion, I need to subtract the latter from the total sales and marketing expenses of 14 billion and from that the remaining growth will be $4.4 billion.

We have also made a more reasonable assumption with higher revenue using the latest one and by adjusting our conservative estimate of the margins for the latest announced layoffs and a lower WACC close to the current one.
Earnings Power Value Calculation
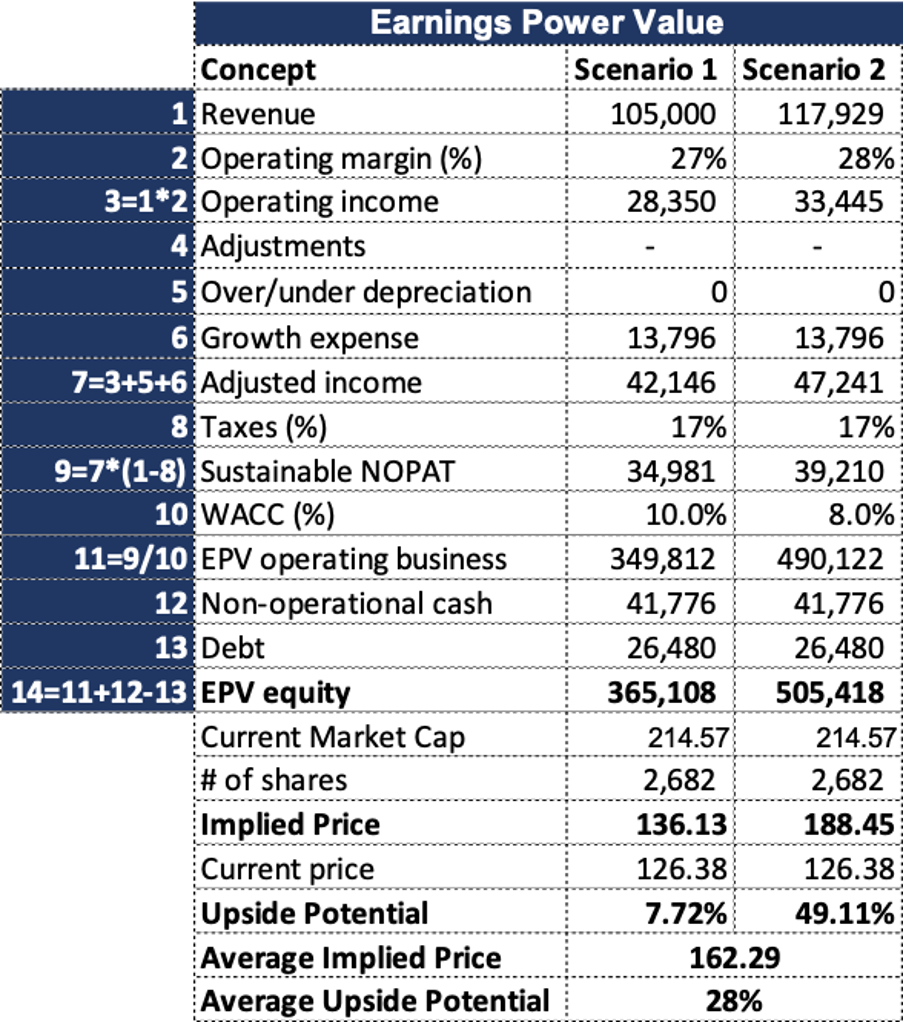
As we can see, there is a huge difference between the asset value of $86.75 and the Average EPV of $162.29. This indicates that META may have a competitive advantage (MOAT), so paying for growth might be justified. But we want to be conservatives and don’t want to pay for growth. Even at current levels, there is enough margin of safety for an investor to feel comfortable.
Conclusion
In this valuation, we could argue that we have adopted a doomsday scenario, in which we have compressed operative margin, being quite severe with WACC, and have included not only zero growth but in scenario 1, we also assumed a contraction of revenue, assuming that all the Metaverse investment would be completely lost, referring not only yo the previous but also to the future investment, since in the EPV we have assumed that Zuck will keep investing 12 billion yearly and receive not benefit from it.
Even in such circumstances, Meta is a great buy. We recommend buying at this level and holding at least up to $165 to $180.
If we start to receive a breath of fresh air on the metaverse front or growth starts to pick up again due to WhatsApp and/or Reels, META (META) should be worth north of $250.