Stellantis: A Strong Buy Amidst Industry Turbulence and Undervaluation
Brief Summary
- Market Position and Challenges: Stellantis struggles with innovation in the electric vehicle sector, lagging behind leaders like Tesla and BYD. High interest rates further strain the automotive market, complicating consumer financing and impacting vehicle sales.
- Brand Perception and Quality Issues: Significant brand perception challenges, especially in the American market, are exacerbated by multiple recalls affecting key models like the Jeep Grand Cherokees and Citroen, DS, Opel, and Peugeot brands, leading to potential safety concerns and eroding consumer trust.
- Financial Performance: Stellantis has experienced a notable decline in revenue, with a reported 12% drop in net revenues year-over-year in the Q1 2024 and an inventory buildup indicating ongoing sales difficulties despite modest gains in electric and low-emission vehicle segments.
- Investment Potential and Valuation: Despite current challenges, a deeper financial analysis reveals potential undervaluation. Stellantis maintains strong financial resilience with $19.5 billion in net positive cash and a sustainable dividend yield of 7.5%, suggesting investment potential under a conservative valuation approach.
- Value Investing Perspective: Stellantis presents a compelling buy for value investors due to its undervaluation relative to intrinsic metrics, bolstered by substantial cash reserves and a robust dividend yield. Applying conservative value investing principles, including Greenwald’s EPV model, suggests a potential for significant upside despite the broader market's pessimism and operational challenges. This aligns with a value investment strategy, emphasizing potential gains from a recovery or normalization in market conditions.
Market Dynamics and Industry Challenges
The auto sector is notorious for its competitive margins, and with the evolution towards electric vehicles (EVs), companies lagging in innovation are finding it particularly tough. Stellantis, despite its efforts, is among those caught behind, which is especially evident in the struggle to compete with industry leaders like Tesla and BYD. This struggle is compounded by high interest rates, which depress the automotive market further since most consumers rely on financing to purchase vehicles.
Currently, Stellantis is facing significant brand perception issues, particularly outside of Europe, in the American market, where the quality of its cars is frequently questioned. This sentiment is reflected in several recalls, which have not only impacted sales but also the brand's reputation:
- Plug-in Hybrid Electric Vehicles (PHEVs) Recall: Stellantis has recalled over 90,000 vehicles across brands like Citroen, DS, Opel, and Peugeot due to fire risks associated with the drive battery support potentially leading to water damage and rust.
- Jeep Grand Cherokees Recall: This recall involves more than 354,000 vehicles globally due to improperly installed rear coil springs that could detach while driving, posing serious crash risks.
- Chrysler-Fiat Airbag Issue: In Canada, over 10,000 Chrysler 300 and Dodge Charger models from 2018 to 2021 have been recalled due to a defect in the side curtain airbag inflators, which could unexpectedly rupture and send metal fragments towards occupants.
These safety issues necessitate urgent attention and action from Stellantis, affecting consumer trust and potentially future sales.
Recent Performance and Market Reaction
The inventory levels reflect ongoing struggles, with unsold cars accumulating:
- Share Price Drop: Stellantis' stock has plummeted by more than 24% in just over a month.
- Quarterly Financial Report: The Q1 report showed a 12% drop in net revenues year-over-year, shipments decreased by 10% to 1.3 million units, and a total new vehicle inventory rising to 1.39 million units.
- BEV and LEV Sales: There has been some positive movement, with battery electric vehicles (BEVs) and low-emission vehicles (LEVs) sales up by 8% and 13%, respectively., but not enough to spark any optimism.
Valuation and Investment Potential
As a value investor, my focus is on areas the majority might overlook, especially when they abandon quantitative evaluations. I aim to delve into the numbers to gauge the market's level of pessimism and to determine if the prevailing nervousness has led to unrealistically low valuations. This could signal a potential buying opportunity for me. I'm aware that I'm not investing in a top-tier business; rather, I'm betting on a mediocre business priced too low to ignore, despite the challenges it faces
Despite the pervasive pessimism, which has led many traders and funds to steer clear of the sector, a deeper dive into Stellantis' numbers suggests potential undervaluation:
- Financial Resilience: Stellantis boasts $19.5 billion in net positive cash and has increased its dividend to $1.65, yielding about 7.5% at the current stock price. This dividend is sustainable, supported by a robust balance sheet valuing the company at $65 billion with earnings of $20.5 billion.
- Investment Strategy: The company's commitment to reinvestment is evident from its billions of capital expenditure in the past three years, aiming for a return to be competitive.
A value investor might argue that this is not growth capex but essential spending, because not investing in EVs means falling behind. I can agree with this viewpoint, which is why I do not include the growth capex. Historically, this company achieved an ROIC of nearly 20% and, by reinvesting 50%, should theoretically generate 10% growth. This is evidenced by their new acquisitions and the 25 new models coming this year, so ignoring the impact of this substantial capex is still quite a conservative stance, to say the least."
Valuation and Financial Analysis
I've put together a rough valuation model, somewhat similar to the one I use for Meta, acknowledging that Stellantis doesn't match the same quality level of business. I've assumed a revenue decline of roughly 15% from the last year levels and a margin contraction to 9%, although the CFO recently reiterated that they expect to maintain double digit margins. But, for a conservative approach, let’s stick with the more pessimistic margin.
Earning Power Value (EPV) Assessment
The EPV model, developed by Professor Bruce Greenwald at Columbia University, is a staple in my value investing toolkit. It's designed to calculate sustainable earnings without growth. As per book I should add to the sustainable earnings calculation to the side the money spent on growth that are not maintenance, because on the long-term those capex will eventually stop however in a twist to adopt a very conservative stance, I hypothesized that all growth capex, which is significant, is completely lost—like throwing money in the bin.
Despite such a severe assumption that the reinvestment rate at 20% ROIC would generally suggest a 10% EBIT growth, the market doesn't see this as feasible, and neither do I. I prefer to err on the side of market wisdom and stay pessimistic. Using a leveraged beta of 1.41, I've calculated an equity premium of 7.8% over a WACC of 12%. Given the risks involved I have added an extra layer of 3% discount over my cost of capital, bringing the total to 15%. Even with these conservative figures, I still see over a 50% upside potential.
An Intrinsic Valuation Perspective
As a value investor, I typically avoid using DCF models because the number of assumptions required could create a false sense of security with seemingly complex outputs. However, it's useful to understand the potential numbers that could appear in a DCF analysis, especially with assumptions that align with those used in Earning Power Value (EPV) models, and to identify the drivers that could influence the valuation.
Market analysis indicates a clear reduction in EBIT and an absolute lack of growth. Initially, I thought the WACC might have been inaccurately calculated. As Stellantis operates internationally, it's crucial to consider the risks associated with global operations, sometimes even if the cost of capital isn't a predominant consideration for some investors.
In past analyses, I have discerned how different assumptions about the WACC can significantly alter stock valuations, impacting the attributed equity premium or beta. This is not the case, but it is why I wanted to have a thorough analysis of the beta and WACC and, therefore, I have written a session only for approach these elements which you will find below in the report.
So far, the WACC is not the issue, I believe the market is currently overstating the impact of growth reduction on the stock; only a 14% loss would justify the current market valuation.
I am presenting the first DCF model in which I've maintained some assumptions similar to those in my EPV analysis. These include management projections up to 2028, after which I've aligned with the consensus for the terminal margin. I've considered a minimal growth of 1.5% up to 2028 and no growth beyond that date. For both cases, the WACC used is 12%. Please refer to my paragraph discussion on WACC for more details.

We are again very close to the Earning Power Value (EPV) and also to the stock value before the last earnings call. However, the current market price implies a substantial 14% drop in revenue, which seems at odds with the company's high reinvestment rate. Stellantis's strategy involves reinvesting heavily—more than 11 billion annually, representing a 50% reinvestment rate. Such a significant commitment to reinvestment typically does not align with the narrative of a steep decline in growth prospects. If this revenue drop persists, it may compel the company to reassess its reinvestment strategy. They might either reallocate these funds more effectively or adopt new measures to enhance value distribution to shareholders and implement cost-cutting strategies to improve long-term EBIT. Under the leadership of Carlos Tavares, an expert manager, Stellantis is equipped with top-tier, highly reliable management that is well-prepared to navigate these challenges
Weighted Average Cost of Capital at 12%
Value investors traditionally dislike using beta and calculating the WACC. I understand their perspective but also think that when performing an intrinsic valuation of a stock, it's crucial to carefully reflect on the value of risk to accurately assess the premium. Using an equity premium that might distort the intrinsic valuation of the stock is risky; it could be too high or too low for the specific stock, potentially rendering the intrinsic valuation impractical. Additionally, when deriving an Earning Power Value (EPV) by capitalizing the cost of capital, it's essential to have a defendable, objective cost of capital; otherwise, the EPV lacks credibility.
You might disagree with defining risk as volatility based on standard deviation from historical movements, in that case you could use other approaches, like bottom up beta or others that allows for a baseline beta valuation or alternative methods.
I aim not to bore the reader with different WACC calculations and their methodologies in this research, but rather to present the information I've collected. We start with the assumption that the 10-year Treasury rate is not risk free and depurated the embedded default risk, that’s why we have used 4% rather than the actual rate of the 10-year. We then compile the revenue information and assign a weighted average premium to each region. This step is crucial, especially for a company operating globally including potentially volatile and emerging markets, where a lower WACC could significantly impact the valuation. Historical discrepancies in risk perception have sometimes caused dramatic drops in stock prices when the market adjusts.
For the unleveraged beta, I've used the industry average, and then adjusted for Stellantis's debt-to-equity ratio. You can find the formula below for reference.
WACC calculation using Damoran model
Liquidation Value Considerations:
Rather than tediously examining each asset, I opted for a quicker, yet quite realistic approach to estimate the liquidation value. If Stellantis were to liquidate today, here’s how the numbers would look:
- Tangible Book Value: $15.76 per share.
- Goodwill and Intangible Assets: I looked into the $30 billion of goodwill and intangible assets and identified that only $15 billion is directly related to the brand value. These brands would hold value even if Stellantis were to liquidate; other automotive manufacturers could potentially purchase these brands.
- Inventory Valuation: With $22 billion in inventory, applying a 30% discount for quick sales gives us a rough current market value.
Therefore, I don't see Stellantis facing bankruptcy within the next three years. To justify the current valuation at 3.74 times earnings, revenues would have to significantly decline over 30% annually, which seems unlikely. Even at the existing capex levels, which would no longer make sense if growth stalls, Stellantis could still generate 50% of the current market cap in free cash flow in the next 3 years and maintain a residual liquidation value at today's prices.
Market Sentiment and Investment Perspective
I'm not counting on Stellantis to suddenly turn around and fulfill its ambitious plans for 2030 under CEO Carlos Tavares. If it does, the stock might hit $60, but that’s not where I’m placing my bets. I’m interested in the company's real worth, which seems overlooked. I am going to use a simple value formula to derive the value.
Rate of Return
Formula = R t,t+1 = Dt/Vt + gt,t+1 + (1+gt,t+1) * ht,t+1
Where
Dt = share repurchase + Dividend + Net debt repayment + Interest rate
Gt,t+1 = Marginal ROIC * Reinvestment rate
Reinvestment rate = Growth Capex / Adj. NOPAT
ht,t+1 = Multiples Expansion/Compression
For this instance I am going to assume a zero growth and not debt repayment
• Dividend Yield: 7.5%
• Buyback Yield: 3.5%
• Growth (gt): 0% (assumption of no growth)
• Initial P/E Ratio: 3.3
• Target P/E Ratio: 5.0
Where
• Dt (Total returns from dividends and buybacks): 7.5% + 3.5% = 11%
• Gt,t+1 (Growth rate): 0%
• ℎ+1ht,t+1 (Multiples expansion): (53.3−1)=51.52%(3.35−1)=51.52%
Plugging these into the formula, the expected rate of return, considering the multiple expansion, is approximately 62.52%.
To calculate the annualized return:
Annualized Return=(1+Total Return)(Number of Years1)−1
The annualized return over a 3-year period, based on the initial single-year return estimate of approximately 62.52%, is about 17.57% per year.
In understanding this valuation, it's important to note that it includes an assumption of multiple expansion, which might seem too optimistic. However, we're in a high-interest rate environment, and it's reasonable to expect rates to drop over the next three years. If you set aside the multiple expansion, the stock could still offer an annual return of 11%. This is not bad, considering it also gives you a free shot at additional gains if CEO Carlos Tavares even partially achieves his goals. It’s a situation where if things go well, you win; and if they don’t, you don’t really lose much — tail you win, head you don't lose that much."
Conclusion
Stellantis, despite its current challenges, presents a value buy opportunity. The potential for significant upside and a robust dividend yield makes it a compelling investment in a market that may be undervaluing its fundamentals.
I then rate Stellantis a Strong Buy.
Risks
The prevailing high-interest rate environment is elevating financing costs for consumers, potentially suppressing automotive sales. Should interest rates persist at these elevated levels, or if anticipated rate reductions fail to materialize, Stellantis could see a significant impact on both sales volume and stock performance. Particularly, if the so-called 'Fed put'—an expectation of Federal Reserve intervention during economic downturns—does not provide the anticipated market support, there could be further downside risks. If sales decline exceeds our projected 15% and profit margins deteriorate beyond current forecasts, Stellantis' stock may experience substantial valuation pressures.
Investment Insights from recent interview on VisionForex: Are there opportunities to invest in the markets today? (Part 1)
Today, I'm thrilled to share the video of a recent interview on the Italian Channel VisionForex where I had the opportunity to discuss our team's investment philosophy and uncover potential opportunities in today's market landscape.
First and foremost, I extend my heartfelt thanks to Giancarlo Dall'Aglio and Francesco Cerulo for facilitating this enriching discussion and to the whole VisionForex's community for the support. I cannot wait the watch the second part!
At Moat Investing, we adhere to a philosophy we've coined as "a modern take on Value investing". Our approach focuses on identifying solid companies trading at reasonable prices, with a keen eye on avoiding inflated valuations. We firmly believe in the importance of investing with a margin of safety, safeguarding our portfolios against unforeseen risks.
Now, let's delve into the heart of the matter – the current investment landscape. Amidst the chatter surrounding renewable energies, we've found intriguing prospects in an unexpected sector: coal, particularly in the metallurgical domain. Despite the prevailing narrative, certain companies in this sector appear undervalued, presenting compelling investment opportunities.
During the interview, we spotlighted two companies that caught our attention: Alpha Metallurgical Resources (AMR) and Warrior Met Coal (HCC). AMR stood out for its prudent capital management, demonstrating a strategic deployment of free cash flow through share buybacks. On the other hand, HCC offered a more speculative outlook, with promising growth potential driven by strategic investments in high-quality mining assets.
In conclusion, while the coal sector may carry inherent risks, we believe these select companies hold promise for investors with a medium to long-term investment horizon and a balanced risk tolerance. Our team remains vigilant in uncovering opportunities that align with our investment philosophy, seeking value in overlooked corners of the market.
Stay tuned for the second part of the video!
The Sea Change in Finance: Navigating Interest Rates, Volatility, and Credit in a Sticky Inflation Era
In an era where the term austerity seems to have faded into the archives of economic history, the specter of sticky inflation is rising to the fore. We are witnessing a world where fiscal spending and global expenditure are increasing at an unprecedented rate, bringing us into a new economic phase that demands our attention.
As the Federal Reserve and European Central Bank (ECB) grapple with sticky inflation, interest rates are set to rise. Both institutions will need to continue their hikes, possibly even exceeding 6%, to keep inflation in check. With consumption and restaurants booming in the Eurozone, the UK stands in contrast, struggling with unique challenges of its own.
The real concern is that the swift, generous monetary policies in response to the current economic situation may set the stage for future crises. It's only a matter of time. Short-term interest rates alone aren't enough to create tighter financial conditions. Most old mortgages have locked in favorable rates. This environment may even facilitate a carry trade, with short-term interest rates higher than long-term ones, creating a "reverse yield curve."
The key to navigating this shift lies in understanding Quantitative Tightening. Central banks are trying to "break the system" slowly with gradual rate hikes, avoiding the need for early market rescues. Unless things break down entirely, no immediate rate cuts are expected.
Fast forward to a future with a potential 5% interest rate in the next few years. This scenario would necessitate a major repricing of many financial assets, a shift that hasn't occurred yet. Caution is warranted.
Now, if we imagine a trajectory where the 10-year yield heads towards 4-4.5%, we can foresee a surge in market volatility. This increase would impact various sectors, especially those heavily reliant on favorable interest rates for funding, REITs, and Tech companies. If the market refuses to revert to the mean, existing policies and business models will likely need an overhaul to survive.
Credit is another arena requiring keen scrutiny. While it's been relatively stable, I predict an increase in default rates in the coming months. While I don't foresee a double-digit rise, some pressure is undeniable. In such an environment, government bonds don't offer a compelling spread, making them less attractive.
In terms of investment opportunities, certain areas within the credit sector show promise. For instance, defensive high-yield sectors in Europe could offer value, though one must act quickly as opportunities can be fleeting. Banks too present an intriguing prospect. However, I advocate for caution and recommend positioning against certain REITs and tech SPVs, which may struggle in this changing environment.
Preserving a healthy cash reserve is advisable. Treasury and high-grade financial bonds are potentially good choices, offering an added layer of protection against volatility. If we experience an increase in volatility, well-diversified portfolios are expected to fare better.
Our current global financial situation is shifting from a low-inflation environment to a persistently higher one. In such a landscape, private bonds may find support from governmental bodies. However, with soaring inflation, the freedom to cut interest rates as liberally as in the past is dwindling. It's crucial not to overleverage, to stay invested, and to make sound, careful decisions in these challenging times.
In summary, while the market environment is undoubtedly tough, it's filled with opportunities for those who can navigate the storm. This era demands prudence, adaptability, and a keen eye for shifting trends. Protecting against volatility and unfavorable valuations is key while uncovering potential growth areas. This changing tide may be challenging, but it is also a time for growth and evolution for savvy investors.
In light of these market conditions and potential risks, as an investment professional, I'd like to outline four primary strategies I would consider for a well-balanced portfolio. Each position is aimed to mitigate risks and capture potential opportunities in this changing economic landscape.
- Defensive High-Yield Sectors in Europe: There may be pockets of opportunities in these sectors. These are expected to provide yield in an uncertain environment.
- Government Bonds and High-Grade Financials for Protection: These are primarily seen as defensive measures against potential instability and volatility. They are not expected to provide significant returns but rather to offer safety and stability to the portfolio.
- Short Positions in REITs and Unstable Tech Business Models: There's an expectation of an industry shake-up due to rising interest rates. Short positions in both real estate investment trusts (REITs) and tech businesses, particularly those with unsustainable models and questionable long-term free cash flow projections, could serve as a hedge against potential downturns in these sectors.
- Maintaining Cash Reserves: Cash reserves are critical for flexibility, enabling quick responses to market changes. They also provide a safety net in case of unforeseen market turbulence.
Remember, in this volatile environment, it's key not to overextend positions. While there are potential opportunities, it's crucial to have the means to stay invested without risking excessive exposure.
Originally published on Medium
Unveiling a Spin-off Opportunity: Sphere Entertainment Co. (SPHR)
In the fast-paced today’s world of investing, it is always exciting to discover a compelling opportunity that holds favorable upside potential. As a discerning value investor, my relentless pursuit is to uncover opportunities where the market may be overlooking a company's true worth, leading to an undervaluation. Today, we shift our focus to an intriguing investment occasion: Sphere Entertainment Co. (SPHR); a spin-off from the renowned Madison Square Garden Entertainment Corp. (MSGE).
SPHERE

SPHERE is an innovative entertainment venue under construction in Las Vegas. It promises to be quite a spectacle with a slated opening in September. Although Las Vegas is accustomed to grand entertainment venues, SPHERE is set to redefine expectations.
Located in the heart of the Las Vegas Strip, adjacent to the esteemed Venetian Hotel, the MSG Sphere (as it is also known) has the potential to become a long-standing central attraction for the city. With a seating capacity of approximately 17,000 to 18,000 and a standing capacity of about 20,000, the venue incorporates cutting-edge technology, including a 190,000-resolution screen enveloping the entire building, spanning an impressive 160,000 square feet.
The SPHERE’s sound system will incorporate more than 165,000 speakers, and its 600,000 LED lights promise to create stunning visual experiences. It is designed to host a variety of events, including concerts, boxing, MMA fights, and esports tournaments. SPHERE promises to be one of the most iconic venues and tourist attractions in Las Vegas and will be even seen from flights landing in the city.
Analysis
To understand the calculations, we first need to understand the structure of the company before and after the spinoff. The original company MSG had broadly four types of assets/businesses,
- Maddison Square Garden
- Sphere Construction project
- Maddison Square Garden Networks
- TAO Group.
As a result of the spin-off, Sphere Entertainment Co. (SPHR) is composed of three assets: SPHERE, MSG Networks, and TAO GROUP. As well as a 33% interest in Madison Square Garden Entertainment Corp. (MSGE).
One development worth noting is the sale of TAO Group a post-spinoff where SPHR is expected to receive a net of $300 million.
Given the complexities surrounding the spin-off, an asset valuation presents a buying opportunity: acquiring the Sphere asset (built at a cost of $2.3 billion) for less than $500 million. This might seem improbable, yet market dynamics can occasionally create such scenarios.
Our calculation methodology takes into account that Sphere holds a 33% stake in MSGE worth north of $636 million at current prices.
To determine the adjusted price of Sphere, we subtract this holding from its overall market capitalization. Additionally, we incorporate a conservative estimate by adding $104 million in cash, considering that approximately $100 million is projected for further construction expenses. Furthermore, we consider the anticipated net cash from the sale of Tao and deduct the outstanding term loan as part of our calculation. We get a price of around $556m which translates into a per share price of $16.02. I must stress the fact that even the initial forecasted cost of sphere was $1.66b provides us with a remarkable discount at current prices.
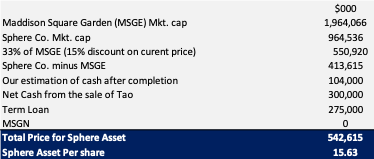
In the subsequent analysis, we will thoroughly examine the valuation of these assets. It's essential to remember that an asset's inherent value is tied to its capacity for generating sustainable earnings and free cash flow. While estimating the revenue potential of a unique asset like SPHERE is a complex task that requires careful consideration of assumptions, even with conservative estimates, the asset's current valuation suggests an attractive investment proposition.
Advertising
It is important to highlight the uniqueness of Sphere as an asset and its tremendous potential in the advertising sector. The exceptional design of SPHERE grants it a distinct advantage, making it valuable for large corporations seeking branding and naming rights opportunities. Based on media reports, we can see that the Dolan family is actively seeking $50 million in naming rights for Sphere. However, in our analysis, we will adopt a conservative approach and account for only $3 million in potential revenue from naming rights.
SPHERE is not just an entertainment venue but a colossal billboard with 580k square feet of fully programmable LED panels. The magnitude of this structure far surpasses anything currently available. This guarantees superior visibility, making it an unavoidable spectacle for local pedestrians, passers-by on adjacent roads, and passengers in planes flying into Las Vegas.
The advertising strategy revolves around the use of digital billboards, with a display time of 10 seconds. This duration allows for a more conservative approach, ensuring advertisers are comfortable with the length of their ads while maintaining competitive CPM rates. It is worth noting that the 10-second duration aligns closely with the standards set by major billboards in prominent locations like New York City and Los Angeles.
To calculate potential revenue, Sphere Entertainment Co. employs a CPM rate of $8, which is deemed reasonable given the company's capabilities. With an estimated impression count of 12,500, the daily revenue estimation is around $100,000. Considering 300 days of advertisement in a year we get an annual revenue of $30 million and applying a 45% operating margin, the projected EBIT (earnings before interest and taxes) from the advertising business alone amounts to $13.5 million.
When combined, the estimated EBIT from the total advertising business, including naming rights, amounts to $16.5 million.
Events
Let's move on to ticketing revenue from concerts, shows, and movies. We could postulate numerous assumptions, but we will maintain a conservative approach to both ticket prices and occupancy rates. An average price of $140 for a concert, considering the anticipated high-profile acts and the Sphere's unique experience, seems reasonable. Assuming 40 concerts per year and a 60% occupancy rate for the 17,000 seats, and a profit margin of 10%, we could calculate the gross revenue as follows:
The gross revenue for one event: 10,200 seats (17,000*60%) * $140 per seat = $ 1,428,000
Gross revenue for 40 events: 40 events * $1,428,000 per event = $57,120,000
Finally, applying the 10% profit margin: $57,120,000 * 10% = $5,712,000 EBIT.
Sphere will also be hosting Movie screenings. The company's plan includes organizing 400-500 screenings per year, with a potential ticket price of $50 per screening.
Conservatively if we assume only 350 screenings in a year with a price of just $35 per seat, an occupancy of just 35%, and a margin of 22.5%, we can calculate the EBIT as shown below:
Gross revenue for one screening: 5,950 seats (17,000*35%) * $35 per seat = 208,250
Gross annual revenue for total screenings: 208,250 * 350 = 72,887,500
10% Profit Margin: 22.5% * 72,887,500 = 16,399,688.
From the Sphere managed events we get an estimated total EBIT of $22,111,688.
Third-party events
The Sphere is also set to host an assortment of third-party events, from concerts to award ceremonies, corporate product launches, and combat sports events. The success and attractiveness of these events depend on the Sphere's performance and its ability to garner external interest. If we consider an annual rate of 10 events with a venue licensing fee of $200,000 and an assumed profit margin of 60%, we can calculate the potential revenue:
Total Revenue: 10 events * $200,000/event = $2,000,000
EBIT: $2,000,000 * 60% = $1,200,000
As explained in the above calculation, we could estimate that third-party-hosted events would generate at least $1,200,000.
Food & Beverages
Regarding food and beverage revenue, we should consider a conservative assumption. Let's assume that 74% of attendees (approximately 7,548 out of 10,200) will purchase food and beverages at each event, with an average spend of $39.50 per person, and a total of 50 events annually:
Per Event F&B Revenue: 7,548 attendees * $39.50 = $298,142
Total Annual F&B Revenue: $298,142 * 50 events = $14,907,100
EBIT: $14,907,100 * 50% = $7,453,550
Revenue breakdown and EBIT estimations
Below is the breakdown of our revenue and EBIT estimations for different sources of revenue.
- Sphere-Hosted Events:
- Revenue: $130million
- EBIT: $22.11million
- Third-Party Events:
- Revenue: $2million
- EBIT: $1.2million
- Food & Beverage Sales:
- Revenue: $14.91million
- EBIT: $7.45 million
- Advertising:
- Revenue: $30 million
- EBIT: $16.5million
Total Revenue: $130 million (Sphere-hosted events) + $2 million (third-party events) + $14.91 million (F&B sales) + $ 30 million (advertising rights) = $176.91 million
Total EBIT: $22.11 million (Sphere-hosted events) + $1.2 million (third-party events) + $7.45 million (F&B sales) + $16.5 million (advertising) = $47.26 million
So, with these estimates, the Sphere's total annual revenue would be approximately $176.91 million and its total EBIT would be approximately $47.26 million.
In this case, the value of Sphere could be $47mil EBIT x 15 multiple equal to $709 million.
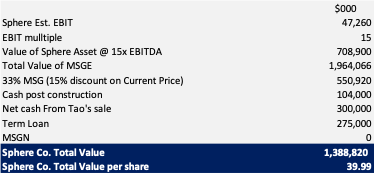
Indeed, the initial EBIT assumption of $47 million might seem rather conservative, especially when considering the scale and potential of the Sphere project. Given the Sphere's substantial initial budget of $1.66 billion, one would expect a target yield of at least 5 to 6% to justify such an investment, which translates to an EBIT in the ballpark of $83 to $99 million.
Therefore, estimating an EBIT of $75 million appears more realistic and aligns more closely with the expected return on investment. At a multiple of 15x EBIT, this would suggest a valuation for the Sphere alone of $1.125 billion, translating into a share price of $51.68..
This analysis, of course, rests on the assumptions that the SPHR will be able to generate such an EBIT, that a 15x EBIT multiple is appropriate, and that market conditions will be conducive for such performance. It also depends on the successful completion and operation of the Sphere. Remember, while we strive to be as precise as possible in our projections, the actual outcome may differ due to unforeseen market factors and operational challenges.
However, it's worth noting that even at a valuation of $1.125 billion, SPHR is significantly undervalued compared to its initial forecasted cost of $1.66 billion. The discount becomes even more pronounced when considering the revised construction cost of $2.3 billion. These discrepancies underline the potential value opportunity at hand, given successful execution and favorable market conditions.
Sensitivity Analysis
The table below highlights the valuation of SPHR at different EBIT assumptions.

Considering the above a value of $50 to $55 should be indicated for the stock.

Identified Risks & Conclusion
Understanding the forces at play behind the scenes requires an examination of the Dolan family and MSGE. The Dolans have long held controlling interests in numerous companies, including MSGE, which owns iconic properties such as Madison Square Garden. Family patriarch Charles Dolan founded Cablevision, which was later sold to Altice, as well as HBO. His son, James Dolan, has played a significant role in managing Cablevision, MSGE, and sports franchises such as the New York Knicks and the New York Rangers
For us, one of the potential risks associated with investing in SPHR relates to the ownership and management of the Dolan family. The Dolan family has demonstrated a historical tendency to prioritize their own interests over those of minority shareholders.
Recently, the Dolan family reached a settlement amounting to $85 million for a case dating back to 2021 involving the merger of MSG with MSGN. The lawsuit accused the family of orchestrating the merger, overpaying for MSGN, diluting the value of MSGE's public stockholders, and advancing their own interests by enhancing their voting rights.
In fiscal year 2019, Dolan received a total compensation of $54.1 million, earning him the highest CEO salary in the media sector for that year, according to an analysis conducted by S&P Global Market Intelligence. The majority of his compensation was comprised of stock and option awards totaling $49.9 million. In March 2019, a lawsuit was filed in the Delaware Court of Chancery, alleging that the MSG board had violated their fiduciary duties to stockholders by approving Dolan's compensation.
In June 2020, the company reached a settlement with a shareholder, and Dolan agreed to relinquish additional one-time stock awards in MSG Sports and MSG Entertainment.
Another aspect to consider is Sphere Entertainment Co. anticipated project in London. As value investors, we prioritize the return of capital to shareholders through means such as buybacks and dividends, which is one of the reasons we favor $OXY. However, with this company, there is a risk that the cash flow generated from the Vegas project may be allocated toward the development of SPHERE in London. Not only is this an inherently risky capital allocation decision for growth purposes, but it is also, in our view, an unfavorable business decision due to the vast cultural differences between London and Las Vegas.
London serves as a prominent global business hub with a distinct professional atmosphere, where evenings tend to be quieter. Concerns have already been raised by British individuals regarding the potential night-time illumination of SPHERE. Consequently, we firmly believe that utilizing cash flow to pursue the development of SPHERE in London poses a significant risk.
Moreover, given the Dolan family's past actions, we consider it highly likely that they may repeat a similar pattern in the present circumstances. It is worth noting that the Dolan family faced lawsuits in the past when they merged MSGN, with allegations suggesting that the merger was driven by the need to fund their Sphere project. These legal disputes further reinforce our concern regarding their potential utilization of cash flow for the development of SPHERE in London.
Another risk to consider is the situation concerning MSGN. It is important to note that the loan associated with MSGN is non-recourse, which is the primary reason why we have assigned a conservative valuation of zero to it. Our concern lies in the possibility that the Dolan family may be reluctant to relinquish control of MSGN, even if the company encounters difficulties in repaying its loan. Their actions might not align with the best interests of the overall group if it comes to safeguarding the legacy network company.
It is also important to highlight the significant increase in SPHERE's construction costs, which currently surpassed $2.3 billion, exceeding the initial forecast of $1.66 billion. It remains uncertain as to how much further the costs for this construction project might escalate, and whether the newly scheduled opening in September can be adhered to, or if it will need to be postponed again, as has occurred in the past.
However, when evaluating the risk-reward profile associated with investing in SPHR, we find it to be generally aligned with our risk appetite. That being said, considering the theoretical nature of the EBIT calculation, the lack of a sustained earnings history, the risks associated with the Dolan family, and the potential long-term operations, we would limit our exposure to no more than 3% of the total portfolio. This precautionary approach provides a balanced way to participate in Sphere's potential upside while mitigating downside risk.
In conclusion, it is important to reiterate that this investment is primarily focused on the potential value of the underlying asset, with uncertain earnings at present.
META - A Value Opportunity In The Tech Environment
The accounting representation of Tech companies is key to understanding their value. Only if you dig deep enough can you appreciate their fair value, and being a conservative Tech investor is not easy. Value investors are usually unwilling to pay for growth, and finding a tech stock where growth is not priced in is a rare beast or a value trap.
Asset protection is hard to assess because Tech companies are asset-light and intangible, and Goodwill represents most of their assets. One needs to be skillful in recreating an adjusted asset valuation to understand the true essence of the balance sheet.
Why would any analyst be worried about recreating an adjusted balance sheet of a tech company? That’s what a fundamental value investor should do, and in this article, we discuss why while applying this concept to this very debated company.
In this article, we are going to:
- Recreate a conservative Asset value for META (META) to compare it to its EPV (Earning Power Value).
- Compute EPV calculation.
- Explain why META is undervalued even when considering all the investment in reality labs as lost with zero growth priced in the valuation
- Conclude that from its current price, there is a limited downside possibility, and multiple are so compressed that any easing of the micro conditions or small improvements of margins or revenue could drive META to outperform the market.
Why EPV?
Earnings Power Value is a measure of sustainable earnings used often by Proof. Greenwald at Columbia University is a proxy for putting in perpetuity at WACC a company’s sustainable earnings, smoothing out revenue and margin that are not considered within the norm, mostly averaging them after understanding the firm's typical cycle.
We have previously employed the value investing framework in assessing companies like Silvana or Menzies, and for both, we exit at more than 100% gain, but publicly until now, we haven't analyzed a tech company using a value approach; we intend to try now with META (META) since among the FAANG it seems the one where the market is discounting the worse possible scenario.
Only once we have assessed that a company is able to produce superior returns, meaning that having capitalized sustainable earnings which are superior to its asset value, we can dig further to verify that the company enjoys barriers to entry. Therefore we can analyze what is called franchisee value, which is the ability to generate higher returns on invested capital over its cost of capital.
That’s what Munger calls a "great business for a fair price" When he refers to the importance of a business having a MOAT and the ability to compound returns at a rate higher than WACC. How much to pay for its growth is a key metric in buying a great business without losing sight of a realistic valuation.
Asset Value of META
Starting with asset valuation, some of you might think that asset valuation does not have any meaning for tech companies, but it does provide the opportunity to verify the essence of the moat when compared with their sustainable earnings.
Let’s take a glance at the balance sheet. It’s not a surprise to see how low leveraged META is, with an asset value, according to the last available statement, of $179b and an equity value of $124b, with only $55b in liabilities, including $16b of accrued expenses. If we look at the goodwill amount, it is about $20b, which includes amounts related to the acquisition of Instagram, WhatsApp, Oculus, and other smaller firms.
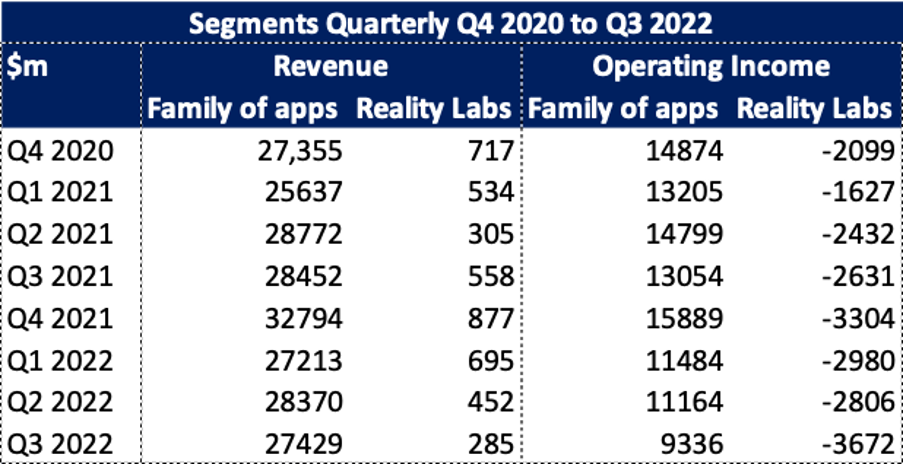
So, meta reports its revenues into two segments: Family of Apps and Reality Labs. With the latter, the main issue is $10b “lost” in 2021, and only last quarter loss of $3.6b, and Zuckerberg does not seem to be interested in stopping this, which some value investors are calling a bloodbath.
The Reality Labs' issue is the key to understanding META's stock price crises. Realty Labs' cost is dramatically increasing, the operative cost was 3.95 billion, and its trend has been up north of 50% in the last year, and it shows no sign of coming down. The table below highlights the breakdown of revenue and operating income between the family of apps and Reality Labs.
This investment is, as we know, far from becoming profitable. All of you that came across the famous Christensen book “The Innovation Dilemma” perfectly understand META's current stage and the main problem of its founder.
A company at this stage could become a cash cow, in which the management could concentrate on returning shareholder value through buyback and improving cost efficiency. However, this does not come as a free lunch. Indeed, it comes at the expense of the company's future growth, which would no longer be there. Instead, investing in growth and new opportunities for new markets would allow the company to try not to get disrupted by other companies in the future. Money spent on growth would eventually come back as a new stream of free cash flow. At least in theory, and only if the company can produce and sell a meaningful, useful product.
In META's reported intangibles, the most important part, the internally generated ones, are missing. The internal product portfolio, software, internal technologies, and platform that METAS has. And the customer portfolio, the billions of people participating in the network that every day log into those platforms to interact. Also, the workforce, engineers, marketing staff, and executives who generate value for the company.
We believe that the valuation of intangibles is the only way to assess the profitability of the company and the possibility that this company can convert investments in research and development into streams of future cash flow.
Assessing Asset Value
To assess those missing internal intangibles, we will proceed as follows.
First, we are going to use a perpetual inventory model to assess the product portfolio, then we will assess the customer portfolio by using the reproduction cost framework, and lastly, we will assess the cost of rehiring the workforce and capitalize on it.
For the workforce, we take the general administrative expenses for the year of $9.9 billion and divide them by 76,000 employees (after firing 11k just a few weeks ago). At this point, the average salary for employees would be 130,000, and we would assume 15% of the headhunting fee in general, which would be a value of roughly $2.5 Billion for the workforce.

The capitalization of the R&D in the product portfolio is not reported, and we want to be conservative and assume that all the money of realty labs would be lost. So, let’s assume that a depreciation of 20% starts from 2014. We are going to use the perpetual inventory method. So, looking at this, we will cut by much the reported R&D and only use the one without realty labs cost.
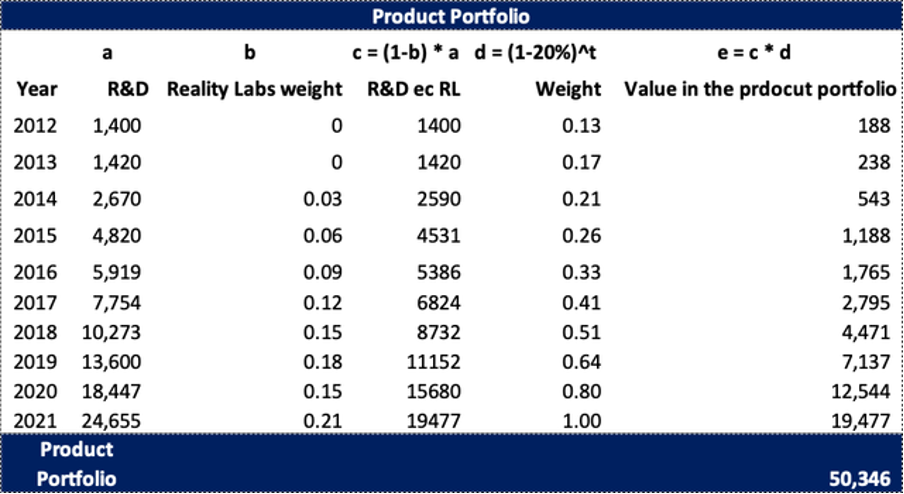
Research and development expenses are the costs spent on developing new products and keeping old products up to date. The classical or maintenance CAPEX is included in these expenses, which is a very important distinction to assess to separate the maintenance costs from the Growth CAPEX.
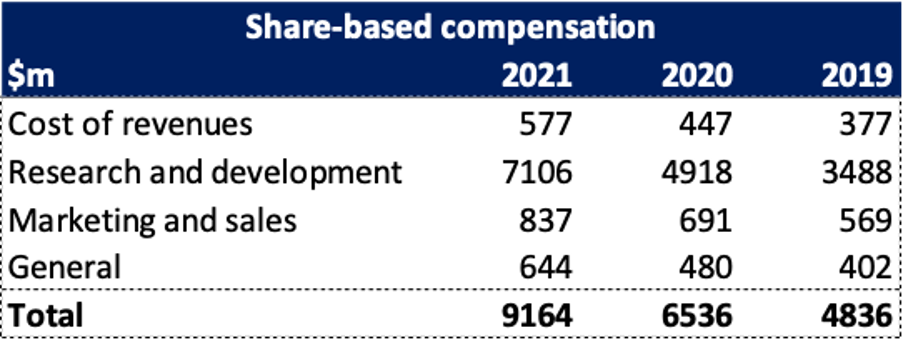
25% of those costs in R&D are based on stock compensation, which is typical of some tech companies, so dilution does happen all the time to pay for this compensation. However, Meta has been buying back, as we know, many shares, but it’s important to assess the real net value of the buying, also considering the dilution in place, to understand if the buyback is a way for the executives to sell their stocks or it would be a way to drive shareholder value.
Sometimes, people tend to jump quickly to conclusions on buybacks. Yes, they could be a great way to create shareholder value if the company does not keep diluting from the other side to compensate its team.
For reference, the table below highlights the cost related to share-based compensation for the past three years.
The second most important factor is the customer portfolio. We will be highlighting both of our models to calculate it for the understanding of our audience.
Traditionally the model we use is based on some assumptions.
The number of customers acquired during the fiscal year is linear based on the money spent on sales and marketing expenses.
The rate of customers acquired per dollar spent on sales and marketing decreases over time (it cost more to acquire the last client than the first one).
Starting from the formula of the customer:
C(T) = (1-a) * C(t-1) + B(T) * i(T)
The customer today C(T) is just the customer of yesterday C(t-1) less the churn rate (1-a) plus the money spent on marketing i(T) multiplied by how much spent in dollars terms convert into customers B(T).
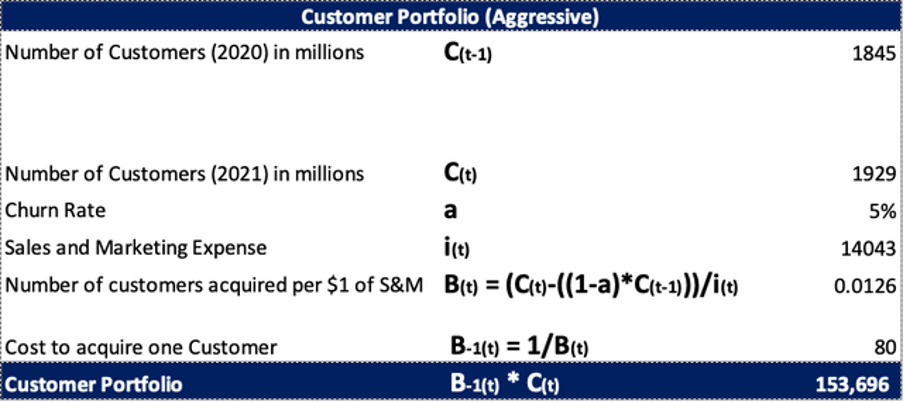
We are assuming a churn rate of 5%, which is the rate at which Meta loses customers every year. For a number of customers, we are using the daily active users (DAU) that Meta reports in their annual reports.
From this, we rearrange to get the B(T) value:
B(T) = (C(T) - ((1-a)*C(t-1))) / i(T)
As we can see, the number of customers obtained for each dollar spent is the customers today minus those who are left after one year, divided by the money spent on sales and marketing.
So, the goal is to find how much a customer costs to be acquired B-1(T), which is the inverse of B(T), and then multiply that by the number of customers to get the customer portfolio, which obviously is not contemplated in the balance sheet.
From the above methodology, the value of the customer base would be m$153,696. Calculations are highlighted in the table below.
Since we are being very conservative with META's valuation, it only makes sense to use a conservative model for the customer base too.
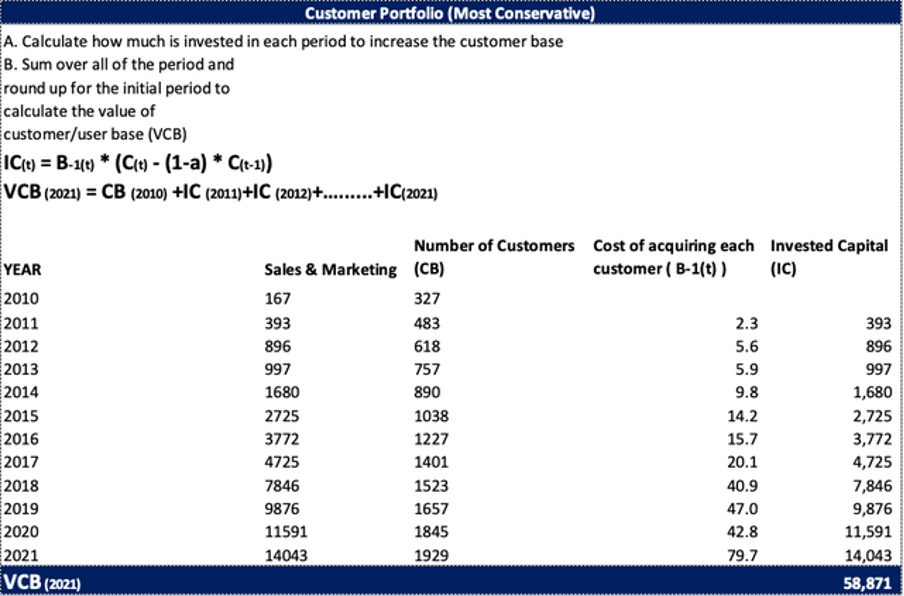
In that model, we first calculate the sum of how much the company invests each period to increase the customer base (IC) for several years and then add that amount to some base period to get the value of the customer base (VCB).
Our conservative estimation of the customer portfolio is shown in the table below, which gives us a value of $58,871m.
So, let’s readjust the asset value to include the missing intangibles we have calculated above. There is one more adjustment that we will make, which is to adjust Goodwill to avoid double counting.
We only want to keep the Goodwill of the brands that still have a separate brand identity, like WhatsApp or Instagram. Since Oculus is now fully integrated with the Meta brand, we would remove the part of Goodwill which was acquired due to Oculus’s acquisition.
Asset Value Calculation
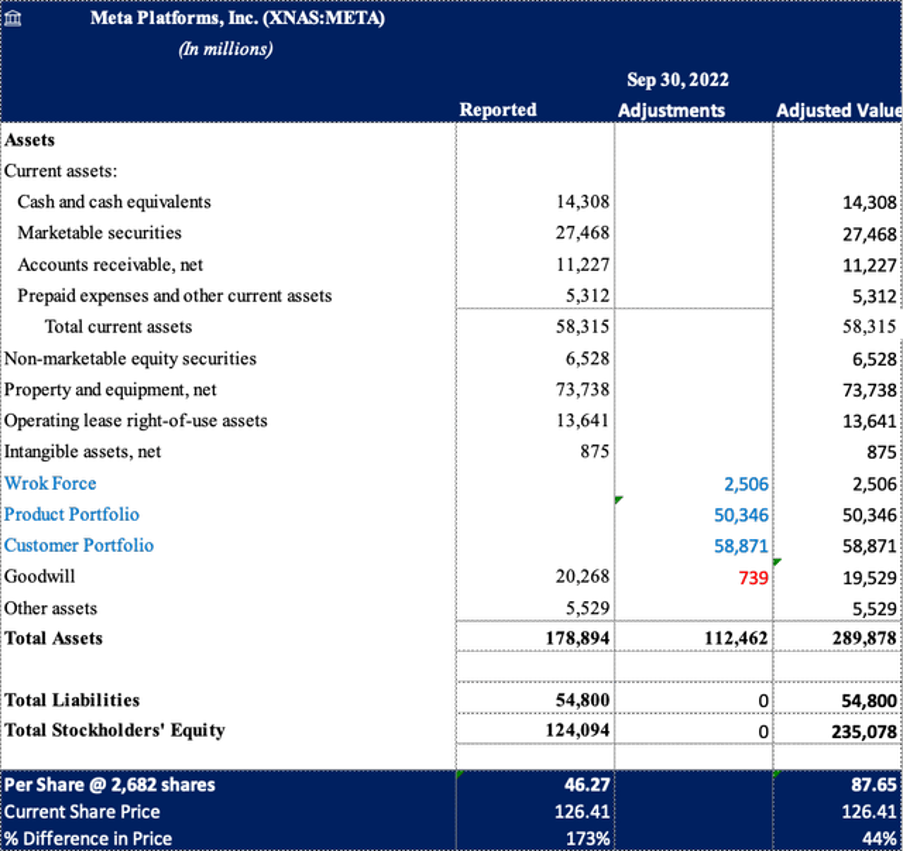
The adjusted asset value we get is $235,078b. We will next calculate the earnings power value (EPV) and compare it with the asset value to identify whether Meta has an economic moat or not.
Earnings Power Value Assessment
We have a revenue estimate, which is lower than the last financial year, so not only are we not accounting for the growth of revenue, we are conservatively reducing the revenue to $105 Billion, which is lower by roughly 11% YoY.
We also use a very conservative margin of 27%, which is much lower than the historical one, close to 40%, also accounting for the huge R&D expenses in realty labs and reels and AI which the company is facing, and they might persist longer.
At this point, we must consider the growth CAPEX related to product and customer portfolios.
If we use the same amortization rate of 20% for a product portfolio worth 50 billion, that will be 10 billion depreciation, intended to be the amount we need for the maintenance CAPEX of the software. To find the growth part, we will deduct the maintenance expense from the total expense of RnD ex Realty labs of $19.4 billion, the total growth part would be around $9.4 Billion.

This is an assumption; of course, we need to believe the 9.4 billion spent on reels, AI, etc., would eventually not be lost. However, at this stage, we do find that to be the case.
In order to understand the growth part related to the customer portfolio we have to calculate the maintenance CAPEX, so it will be the cost of acquiring a client B-1(T) of 100$, multiplied by the 5% churn rate multiply the number of customers of 1.9 bill, so total = 9.6Billion, I need to subtract the latter from the total sales and marketing expenses of 14 billion and from that the remaining growth will be $4.4 billion.

We have also made a more reasonable assumption with higher revenue using the latest one and by adjusting our conservative estimate of the margins for the latest announced layoffs and a lower WACC close to the current one.
Earnings Power Value Calculation
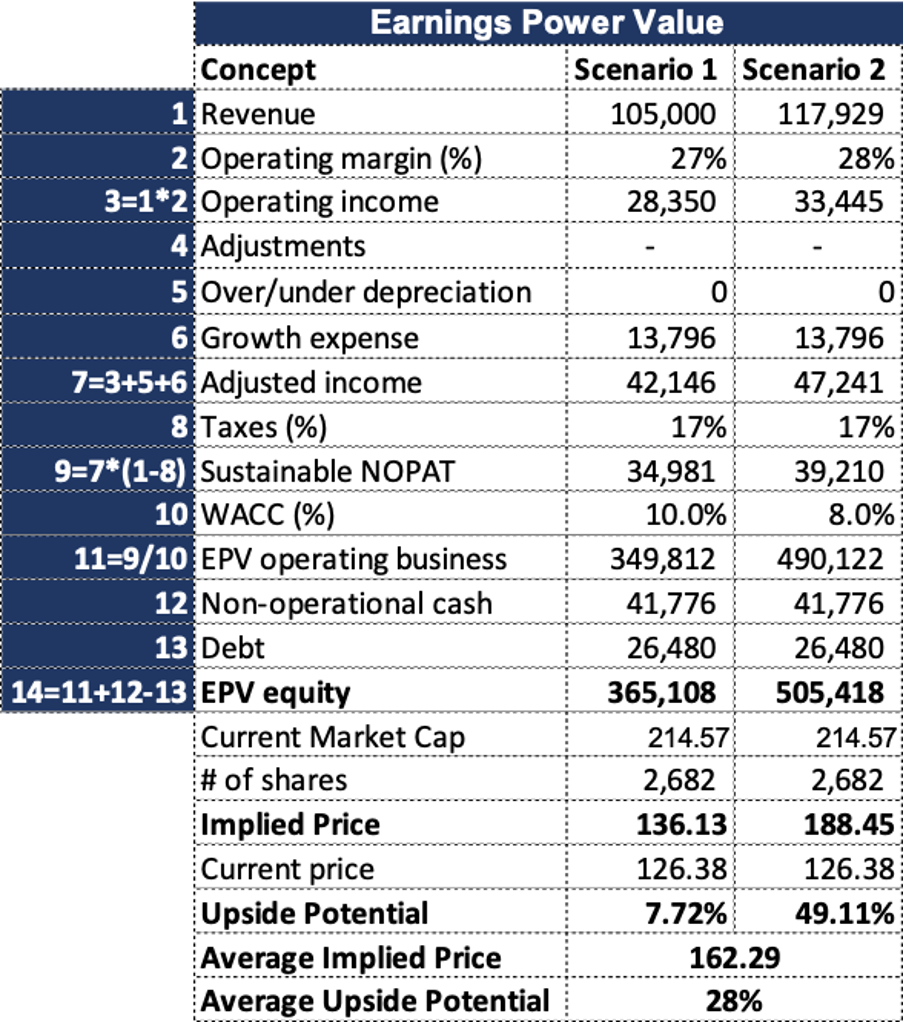
As we can see, there is a huge difference between the asset value of $86.75 and the Average EPV of $162.29. This indicates that META may have a competitive advantage (MOAT), so paying for growth might be justified. But we want to be conservatives and don’t want to pay for growth. Even at current levels, there is enough margin of safety for an investor to feel comfortable.
Conclusion
In this valuation, we could argue that we have adopted a doomsday scenario, in which we have compressed operative margin, being quite severe with WACC, and have included not only zero growth but in scenario 1, we also assumed a contraction of revenue, assuming that all the Metaverse investment would be completely lost, referring not only yo the previous but also to the future investment, since in the EPV we have assumed that Zuck will keep investing 12 billion yearly and receive not benefit from it.
Even in such circumstances, Meta is a great buy. We recommend buying at this level and holding at least up to $165 to $180.
If we start to receive a breath of fresh air on the metaverse front or growth starts to pick up again due to WhatsApp and/or Reels, META (META) should be worth north of $250.
Free thoughts on my wrong investment in ATER
In life and business, consistency is essential. The ability to show steadiness with your thoughts gives you leverage in the form of moral authority. One of the main characteristics that leaders share is stability and commitment to their previous thoughts and ideas. Many “lazy” thinkers (sheep) want to follow somebody they can trust, that does not change their mind. In equity investment, not changing your mind can be fatal – for your capital and the capital you manage on behalf of others.
An equity story cannot be a life commitment, neither can you show devotion to them as a religion or your favorite football team. Things change, executives make mistakes, new technologies come, macro scenarios change, and more than anything else, you could realize you were WRONG. That happens as well, and there is nothing wrong with it unless you persist in the error. Many money managers and equity analysts want to avoid admitting mistakes and stay with their thesis. After years, not only do they look stupid, but they also affect their capital and/or the capital they manage.
I made a mistake with ATER. In the last few years, thanks to God, I did not make many, but ATER was one of the worst I made for sure.
When you sell a stock at a loss, you can use that amount to buy another, and if that new investment goes up, you make money back (with less risk sometimes). So, you don’t have to wait until you recover your losses with the same stock when you can redirect that money into a better strategy. I know it’s obvious, but some people get stuck for years in a losing position without realizing or admitting that it was a mistake when they should have shaken it off and move forward.
In the last few months, from October 2020 to February 2021, we have lived a very hectic stock market period where we had no time to sleep, primarily due to momentum stocks going higher every day. During that kind of pre-bubble time, in which it is impossible to cover all those stocks profoundly, you always have a few that you leave more to your team, rely on third parties, or you go over them by yourself but not with the needed level of in-depth analysis.
ATER was one of those companies I quickly looked at and therefore didn’t pay too much attention to some details that I left in my analysts’ hands. I checked up the models but didn’t have the time to dig deeper into the story, which at the moment seemed a straightforward, growth story.
I have come to believe that DCF for growth stories is something that doesn’t make much sense. Most of it has so many assumptions that it becomes a very risky bet. That’s why I usually prefer Sustainable Earnings (EPV) valuation, which allows us to analyze what the company has achieved in recent years and therefore provides a “feet-on-the-ground” idea of what it can deliver in the future.
I like some small growth stories on which I have small positions on my portfolio, between 1% and 2%, which gives me the ability to spend less time studying the stock because of the implied risk for my overall performance. Of course, I spent much more time analyzing the companies where I have more significant positions and still follow and study them closely.
I would have taken more prominent positions. However, time management is an essential skill, especially in high-volatility environments where opportunity cost is outrageous. You must spend more time on the significant convictions of your portfolio rather than trying to make the impossible and cover all the “promising-looking” stories.
The lack of proper due diligence is behind any mistake
Many FinTwit gurus only push the stories and never go into valuation assumptions or perform a proper strategic analysis of the stocks. They overlook the matter by throwing some multiples (usually P/S and EV/S); those multiples are a hazardous way to value a company. Especially in a period of bullish market in which relative multiples are very high and even more when you choose the wrong peer and compare “apples with oranges.” Different companies usually have distinct growth and risk implications, and this can bring two companies of the same space to have unrelated multiples justifiably by their intrinsic and individual characteristics. So, executing a valuation by simply looking at multiples can be extremely harmful because it might lead you to believe that a company is cheap when it is overly expensive.
Revenue Growth is meaningless to value a company unless it is not aimed to produce future free cash flow. Don’t forget that! Most Tech companies, especially SaaS, are based on a subscription model, and most of their revenue can be converted into EBITDA and then eventually free cash flow. When you buy software companies, 80% to 90% of that revenue can be converted into free EBITDA. Once you consider the cost of customer acquisition and the churn rate, most of the income would be cash, so multiples like EV/S may make some sense.
Because of the above argument, some gurus in the FinTwit community take for granted that EV/S is a useful metric for all Tech companies in general when it is bloody not!
Look at the kind of people we need to answer to on Twitter:

Stock pumping on Twitter is creating virtual boiler rooms
Stock pumpers manipulate followers and leverage their lack of knowledge. FinTwit traders have a dangerous behavior that fraudsters can exploit. When you learn about something, understand the terms and have some experience but don’t comprehend the subject deeply, you could be in danger. Because you are at a stage where you think you can handle a conversation, you can put your head around it, so you feel you don’t have to say, “I know nothing about it,” but deep inside, you know you don’t master that topic. That degree of knowledge is dangerous because it is not enough to address the issue accurately and not too little to let you walk away so that you can get played!
Wrong valuation input leads to big mistakes!
When you do a DCF on a growth story, you rely on multiple extremely difficult assumptions to hit correctly. Terminal growth could be responsible for 60% or more of your final equity value, and the model would be susceptible to the hurdle rate you use and the assumed growth. When you don’t know how value drivers move (Free cash flows either to the equity or to the firm, hurdle rate, and terminal growth), you are not safely investing. For some companies, DCF just doesn’t make sense.
As an example, let’s dig into ATER’s valuation technicals, and let’s try to explain what the issue with ATER is.

Look at what happens to ATER’s DCF model if you change some of the realities of the company to reflect new evidence:
- Raising Hurdle rate from 14% to 16%
- Reducing terminal growth rate from 3,5% to 1%
- Increasing the share count from 23.2 mil now to 26.2 (however, we could also use 30 to incorporate options and higher strike price warrants, but to avoid critics to this methodology, we use the share count on a weighted average basis)

One could argue that 16% as a discount factor is too high? Well, think about it again: if debt holders are getting 8% on a cash basis with an option to avail warrants, the real cost of debt is north of 12%. Wouldn’t the equity holder be compensated a few extra percentage points of risk premium?
The growth dilemma leads to other big mistakes!
That said, let’s now try tweaking the revenue CAGR growth rate. Growth can slow down if the share prices remain depressed. This is because one of the major investment theses of this company revolved around accretive M&A deals. To remain prudent, here we are assuming that the company’s organic growth does not decline, instead remains stable and grows slowly – which is also a big “if” and risky assumption. We will decode this argument later. If you tried to capture this scenario, valuation again drops significantly.

The fallacy of such a method to value this company is that we are missing the whole point by purely basing the valuation on growth assumptions from now to 10 years ahead. Trying to foresee the growth for a company like this is misleading. Revenue doesn’t mean anything; EBITDA is what matters, or, if we dig deeper, how much EBITDA you can convert into free cash flow. This is especially true when the company is externally buying growth at a high cost of capital.
While I was busy, my team prepared a DCF on ATER; sometimes, busy analysts do that quickly by using consensus and maybe adjusting for a higher hurdle rate if they smell implied growth might be high. By inputting consensus numbers and calculating a reasonable hurdle rate, you most likely will understand what the market thinks about the company.
When the initial model was constructed, the M&A activity of the company was done in an accretive way because the market cap was more than two times what it is today. So it was easy for the company to grow by giving shares in exchange. This narrative has now changed, as ATER is down more than 60% from its ATH, and buying assets in exchange for shares is highly dilutive for ATER. Think about it this way: if you are worth USD 1bln and buy an asset worth USD 40 mln, your share base dilution would be 4%. After a 60% share price drop as in the case of ATER, the same deal would lead to a a 10% share base dilution.
If we look at the products ATER bought, they are pure Chinese garbage. Objectively, they are cheap goods that sell well online. How much the company can grow is NOT the most crucial factor here.
A company can grow its sales CAGR at a factor of infinity. Still, the most crucial element is that whatever they sell makes enough money to pay for the debt and gain a reasonable amount of money. Think about it, plain a simple, they can keep buying all the companies they want and become a 100 billion turnover, but they are buying with a capital that needs to be reimbursed after the debt is paid, and that is the key.
So, the parameter you have to adjust in the DCF model is not only growth, but the most critical part is the EBITDA conversion to Free Cash Flow and EBITDA Margin.
Look below:

Getting back to company valuation, the most crucial element to analyze a company is its free cash flow. We all know that valuation is just trying to figure out the future cash flow of a company and bring it back discounted of the hurdle rate to today’s value. Still, some of these genius stock pumpers don’t even know what a hurdle rate is.

When you work on ATER’s model, you take for granted that the EBITDA margin will grow towards 15%, as indicated by the management. Only focusing on the growth will tend to overvalue the company. This is very easy to understand. ATER is buying growth. They are buying companies financing growth north of 12% (8% + warrant), so revenue increase is not an issue that is relatively easy to achieve. It would be best to make sure the company you buy will generate enough money to pay for the debt and remunerate the capital accordingly to satisfy the risk incurred.
Growth is not a helpful metric because ATER is buying it; ROIC is what we have to analyze because if your return on capital is not adequate, you can grow, destroying value. ATER sells stupid cheap Chinese goods, and they have to increase the sales of those products to justify their investment. If they can grow their sales and make a good spread between the money they borrow and what they make, then the business can succeed. However, if these products will go out of favor, or they won’t be able to sell them for a higher price, this company can easily go bankrupt. YES, it can be worth ZERO.
AIMEE is not a competitive advantage
ATER claims AIMEE to be the key to its business model. Well, AIMEE is just a data software that works with data inputs, and it has a code that would analyze data in a certain way. This doesn’t seem to be an advantage or a moat. What should be monitored closely is what kind of advantage AIMEE can offer. In my opinion, it was just one of those gimmicks where a company tried to take up SaaS valuation by selling an investor story involving this tech.
Look at this scary situation, one of the crucial revenue segments is going down dramatically:

Source: 10Q
This is what we need to look for as investors. Can they grow sales of the companies they are acquiring? Their rebuttal was:

Source: 10Q
What happened to AIMEE? They are selling 37% less because of “sell-outs inventory”? So, all this competitive advantage due to AIMEE technology that is supposed to optimize the process does not exist?
A company could hide their organic growth slowing down but keep growing revenue by buying companies at high prices and higher multiples if you don’t have a breakdown of the different companies. These companies could be running a Ponzi scheme, and it would not be easy to spot them if their financials don’t share segment by segment details.
Another FinTwit myth that needs to be clarified: Don’t get fooled by the story that a new high growth story does not have to be profitable. Some companies could not be profitable initially but will be investing heavily in Research and Development (R&D). Think about Amazon, Apple, or any other company that has spent years developing technologies that represent an actual moat. So, if you look at the P&L, you will see hundreds of millions or even billions spent during years to develop a technology.
You will see this cost deducted from the profit. But when the technology is eventually developed, all those R&D will ultimately manifest itself in a growing cash flow stream. In the case of ATER, their R&D is negligible – in 2020, they spend less than 4% of their revenues in R&D.
Conclusions
You should invest in ATER only if you believe that AIMEE provides a substantial competitive advantage. Their organic sales will grow steadily, and their products won’t get out of favor. It would help if you also trusted that they would be able to get better debt conditions. But how would you know that?
Moreover, let’s address two quick issues; in valuation, there are parameters to check for accounting manipulation called Benish Score and Z score. Although the explanation of these tests is beyond this article’s scope, I am not suggesting they are manipulating their books, but the possibility remains.

Nonetheless, a company like this could do this easily because of the setup of the business model. If they don’t show the breakdown of organic growth for each company they buy, they can show a higher EBITDA. Still, we wouldn’t know if EBITDA growth is fueled by a new acquisition (from expensive debt) or was fueled organically. Only the insiders like the CFO know that. ATER, former CFO left after the short report (according to the report, he had previously bankrupted a company).
So, back to the main issue, if the EBITDA growth cannot be assessed accurately, we will never know if it is a company with a stable future. Sometimes you can also define a stock by analyzing who is primarily investing in it. Feel free to go on the Twitter feed and check the kind of people pushing ATER, their financial background, as well as their motives. I was not impressed.
So, if you are a momentum trader and want to ride this, there is nothing wrong with it. If the growth story keeps going up again, ATER could get pumped back to $30 or $40 once again. But remember that price and value remain two different things.
I don’t know, and I don’t care where ATER will go. I don’t want to be seen like somebody who promotes this stock because I don’t feel safe and made a mistake the first time I bought it.
Because I changed my mind about ATER and made some tweets expressing my concerns, I was bullied and even received death threats and all sorts of insults from several Twitter accounts that are bullish on the stock. I have initiated legal procedures, and my lawyer already informed the police that they are constantly monitoring Twitter and taking things very seriously.
This is my last post on ATER, and I don’t want to talk or tweet anymore about it. I am not short yet; I would only take a short position eventually if there is further strong evidence of organic growth slowing and price momentum gaining traction. That said, I will pursue legal actions if I receive insults or threats because of my view and opinions.
About Antonio Velardo
Antonio Velardo is an experienced Italian Venture Capitalist and options trader. He is an early Bitcoin and Ethereum adopter and evangelist who has grown his passion and knowledge after pursuing the Blockchain Strategy Programme at Oxford University and a Master’s degree in Digital Currency at Nicosia University.
Velardo manages an 8-figure portfolio of his investment company with a team of analysts; he is a sort of FinTweet mentor, people interact with him online, and he has more than 40,000 followers after his tweets. He has built a fortune in the great tech years and put together a tail strategy during the pandemic that allowed him to take advantage of the market drop. “I did not time the market, and I did not think this was even a black sworn,” he says.
On the side of the financial markets, Velardo has a unique combination. He was a real estate entrepreneur that developed several projects in Tunisia, Miami, Italy, the UK, and many other countries and cities. But he has always been passionate about options trading. Still, contrary to the volatility player and quant trading, he always had a value investing touch in his blood. Antonio studied Value Investing at Buffet’s famous business school at Columbia University. Even though the central concepts of value investing are antagonists to the venture capital pillars, Antonio’s approach tries to bridge elements of both worlds in order to seek alpha. Velardo has learned the importance of spotting pure growth stories and taking advantage of their S-Curve position. This is an essential element of Velardo’s approach as he looks forward to embracing great tech stories at the right time of the adoption cycle. This applies to stocks but also to blockchain projects.
Assessing Menzies risk to go bankrupt after breaching covenants
Many of you have been reaching out to comment and ask about the Multiple-Valuation approach on John Menzies plc (MNZS). Of course, there are some concerns about the cash-burning, and for that reason, here I address that in this short article.
Relying on the Q3 presentation, we know that:
- Available cash resources of over £175m at 31 August 2020
- Underlying operating cash flow ahead of expectations with good debtor collections and upfront support from governmental agencies
- In January, the Company completed the refinance of the Group’s bank facilities that were due to mature in 2021 and replaced them with a US$235m amortizing loan and a £145m revolving credit facility, both due to mature in January 2025.
- The new covenant structure’s critical terms foresee net leverage covenant replaced with a minimum EBITDA covenant tested on a quarterly basis. The Group must keep a minimum of £45m liquidity. The new covenant structure will remain in place until the earlier of June 2022 or whenever the Group’s leverage as measured on a pre-IFRS 16 basis remains below 3.0 times for three consecutive quarters.
Based on the above points, we know the Company has addressed the liquidity issue and has renegotiated covenants. Now the question is whether these measures are enough to support the Company during the pandemic.
Still, from the Q3 presentation, we know that:
- Market conditions will remain challenging through the winter and the early part of next year, but expect a sustainable recovery in activity levels after that, contributing to modest revenue growth in 2021 over 2020
Assuming a liquidity level around GBP 150mln by the end of 2020 and a cash-burning between GBP 7mln and GBP 12mln per month, we believe Menzies might breach the liquidity covenant over the next 9 to 15 months.
 Source: Our estimates
What happens in case covenants are breached?
There are three possible scenarios:
- The most likely scenario is that covenants are renegotiated as the banking system proved to be supportive of Menzies.
- Menzies might be forced to look for a share capital increase and/or possible asset disposal to reduce its debt exposure.
- A mix of the above two scenarios
A prolonged lockdown scenario is clearly the major risk we see for Menzies shareholders as it might force Menzies to look for a dilutive share capital increase that might occur at a substantial discount to the current share price (227p as of 19 January 2021).
That said, we share Menzies management view for the long term as we expect “Menzies to emerge as a more efficient, agile and profitable business with a more focused footprint having exited stations that are no longer economically viable.”
Actions to be taken
It is crucial to continue monitoring disclosures on liquidity levels. Suppose we do not see a recovery in the level of activities for Menzies by the late summer period (which also carries a positive seasonality). In that case, we might eventually consider reducing our position as the probability of the events mentioned above increases over time.
MNZS Chart
About Antonio Velardo
Antonio Velardo is an experienced Italian Venture Capitalist and options trader. He is an early Bitcoin and Ethereum adopter and evangelist who has grown his passion and knowledge after pursuing the Blockchain Strategy Programme at Oxford University and a Master’s degree in Digital Currency at Nicosia University.
Velardo manages an 8-figure portfolio of his investment company with a team of analysts; he is a sort of FinTweet mentor, people interact with him online, and he has more than 40,000 followers after his tweets. He has built a fortune in the great tech years and put together a tail strategy during the pandemic that allowed him to take advantage of the market drop. “I did not time the market, and I did not think this was even a black sworn,” he says.
On the side of the financial markets, Velardo has a unique combination. He was a real estate entrepreneur that developed several projects in Tunisia, Miami, Italy, the UK, and many other countries and cities. But he has always been passionate about options trading. Still, contrary to the volatility player and quant trading, he always had a value investing touch in his blood. Antonio studied Value Investing at Buffet’s famous business school at Columbia University. Even though the central concepts of value investing are antagonists to the venture capital pillars, Antonio’s approach tries to bridge elements of both worlds in order to seek alpha. Velardo has learned the importance of spotting pure growth stories and taking advantage of their S-Curve position. This is an essential element of Velardo’s approach as he looks forward to embracing great tech stories at the right time of the adoption cycle. This applies to stocks but also to blockchain projects.
Multiple Valuation Models - John Menzies plc (LSE: MNZS)
Lately, we have been focused on growth stories. One of the last value stocks that we covered was Park Hotels & Resorts, which valuation has more than doubled since the article was released. I have been looking at MNZS for some time now but haven’t had the time to dig deeper into it. However, I knew from the beginning that this was the perfect story to be approached by different valuation models, especially Value Investing.
Brief description
John Menzies plc (LSE: MNZS) is the holding company of Menzies Aviation, which provides aviation services in more than 30 countries. John Menzies plc was founded in 1833 and is based in Edinburgh (UK). The company offers several solutions to airports, airlines, and other clients and partners in the sector around the world.
- Fuel services: Fuelling more than 9,500 planes per day at around 80 locations, they claim to be the world’s largest independent provider of into-plane fuelling services and fuel farm management for oil companies, airports, and airlines.
- Ground services: Menzies Aviation handles 1.2 million aircrafts every year. This includes ramp and baggage handling, de-icing planes, passenger services (from check-in to boarding), and cabin cleaning.
- Air Cargo: They manage about 1.5 million tons per year, including logistics, special cargo, and human resources outsourcing.
- Offline services: With more than 20 years of experience, Menzies provides all the services needed, from the maintenance of ground support equipment to baggage tracing and customer relations.
- Executive services: They have a VIP lounge network providing a tailored experience to executive passengers. In 2019 they welcomed 1.5 million guests.
COVID-19 impact on MNZS
The pandemic drastically impacted the valuation of MNZS, opening a unique buying opportunity. The company is now looking to reduce costs and focus on the core business to cope with the industry’s new metrics (lower traffic volumes).

This company has a history of acquiring other companies with the aim to consolidate the sector as economies of scale matter. We think that this is an intelligent move of the management to enter into new markets. Just in December of this year, the company acquired 51% of Royal Airports Services in Pakistan. It also partnered with Lift in South Africa, reinforcing its presence in Africa and the Middle East.
In 2017, Menzies acquired ASIG Holdings for $202 million. For the year ended December 31, 2015, ASIG reported revenues of $415.8m and pre-tax profits of $17.9m.
Because of the COVID-19 situation, the ASIG integration into Menzies industrial plan did not deploy as expected. This is a critical issue that we have factored into our analysis. There is a potential value creation that has been stopped for the time being because of the pandemic crisis.
Investment Thesis
Clearly, the pandemic is the catalyst here and the leading cause of the drastically decreased market valuation. We think that due to the current price of the stock and the COVID-19 foreseeable future, this firm is a candidate for a Value Investing approach.
We will also cover other models and discuss several points of view to undercover the company’s complexity from different angles in these uncertain times. We will check a DCF analysis and its sensitivity chart and review the most used metric in this sector, the EV/EBITDA Ratio.
We will then check if the three approaches will eventually converge towards a similar valuation.
Value investment approach
So how we make the value investment approach? There are a few ways in which we can decide to buy a company from a value perspective, but we will focus on one to assess MNZS.
First of all, we calculate the Asset Value of the company. So we start by looking at the company’s balance sheet and perform some adjustments to make sure that we find a fair value for the company’s assets.
Secondly, we go to the income statement and calculate the Earning Power Value. This is a way of knowing what the sustainable earnings of the company are. So we smooth out the normalized earnings with an average that takes out the peaks in our efforts to assess that.
We then compare Asset Value (AV) to the Earnings Power Value (EPV) because we need to understand the relationship between them to make some value investment assumptions.
When the AV and the EPV have a similar value, we assume that the company is in a competitive environment and has efficient management. When the AV is higher than EPV, it would mean that the company is mismanaged or the company/industry is declining. If the AV is lower than the EPV, it means that the company has superior management and might enjoy entry barriers.
In the latter, which is not the case with this stock, value investors would be in general willing to pay an extra franchisee value for the moat, so a more significant valuation could be justified.
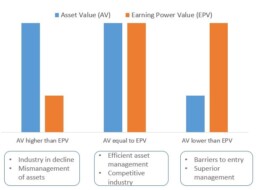
Asset Value of MNZS
The first thing we do is to calculate the actual asset value of the firm. Below you will find the last reported balance sheet, and we are going to change the value of the elements that we think need some adjustment.
- The intangible assets comprise goodwill of 135.5m. These assets have been reduced by 75% to 46.6m to be more conservative about this amount because of potential future impairment.
- Because of the company Property, plant, and equipment leasing model, we have reduced this amount by 50% to 139.9m.
- A further adjustment of about 40% has been made to the Trade and other receivables as we predict Menzies’ clients are under much pressure and distress because of the pandemic. For instance, the Uk airline Flybe declared bankruptcy due to the demand drop because of the pandemic. Flybe was a client of Menzies, and there were rumors that a third of Menzies’ employees at Glasgow Airport were at risk of losing their jobs. As we do not know how the industry situation could affect the receivables, we adjusted the amount to 93.3m.
- As a consequence of the above adjustments, total assets are being adjusted from 890.1m to 495.5m.
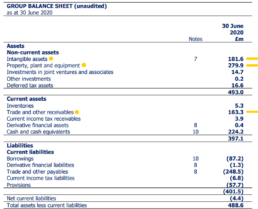
Earning Power Value
As we discussed above, here we are trying to calculate the company’s sustainable earnings. In the case of Menzies, we had to average and smooth some numbers. However, for the most critical adjustment, we had to understand how much of the operating expenses were for growth to add it back.
First, we smoothed out the company revenue for the last five years, 1.4 billion. We then calculated the firm’s average operating margin (2.44%) to figure the Operating Income to 36.11 million. Then we added back the money spent on growth. Breaking down the general expenses, we tried to figure out how much we had to add back. It was a bit tricky, but through the calculations of the acquisitions and other aspects, we could come up with a conservative number of 50 million.
We calculated the normalized tax rate to 27% and estimated the WACC to 9%. The Weighted Average Cost of Capital (WACC) is the company’s proportionally weighted cost of capital, considering all sources of funding.
We then calculated the Earning Power Value of the operating business (698.43 million). To that, we add the non-operational cash and subtract the debt for EPV equity of 452.63 million, which would be the implied market cap. According to this model, there is a 126% upside potential.
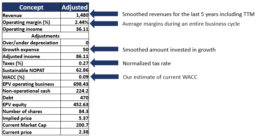
AV, EPV & Margin of Safety
After we applied the adjustments, we still find a reasonable margin of safety, so we think there is significant upside potential. There is a potential 126% upside is according to this approach.
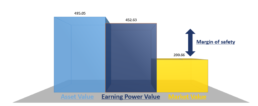
DCF Model
In our Discount Cash Flow model, the central assumption was EBIT growth. An aggressive 50% in 2023, followed by 20% from 2024 to 2026, then 10% in 2020 to a stabilized 5% up to 2030. The discount rate used is 10%, and the terminal growth would be 2%.
At first glance, the growth might seem optimistic. However, the pre-COVID19 guidance for 2021 was 98 million. This year, we are around 62 million; when the pandemic situation is over, at least Menzies should be able to catch up near the previous trend.

Sensitivity Analysis
You can check the fair price according to the discount rate and the terminal growth you would like to pick in the table below. Depending on the used discount rate, you can see the value at 1.8%, and 2% terminal growth can vary between 319.7 million and 543.2 million.
Indeed a fair mean value could be 430 at a 2% and 10% discount rate. However, we would pick a central value of 4.18 for this analysis as we will compare all our valuations at the end of this article.

EV/EBITDA Ratio
Before getting into the EV/EBITDA ratio calculation, we would like to discuss why this ratio is one of the most used and essential metrics to approach companies in this sector. You will also understand why do we think that Menzies is an excellent acquisition target in the industry.
One of the global’s Ground Handling leaders, Swissport, expressed their willingness to acquire new companies to enhance their market position a few months before the pandemic started. They have already made some crucial acquisitions like the Heathrow Cargo Handling in February 2019 and the Apron and Aerocare acquisitions in 2018. For the last, they paid a multiple of 10x EBITDA.
Worldwide Flight Services is another potential buyer. In 2018 they were bought by Cerberus Capital Management for a multiple of about 12.5x
Back in July 2015, the Chinese conglomerate HNA Group acquired Swissport with a price of 11.5x EBITDA. PAI Partners, the former owner of Swissport, acquired it at 11x EBITDA in 2011.
We already mentioned the acquisition of ASIG by Menzies. The EV/EBITDA multiple of that transaction was 9.9x
Menzies is a small-cap company with a good track record and promising opportunities for the future. One of the industry’s big players on the private equity side could purchase the company as it is an excellent acquisition target.
As we see, the EV/EBITA Ratio is one of the most used metrics to approach companies in this sector. WE would say that a ratio between 8 to 10 is considered adequate as transactions for this type of firm’s acquisitions have been historically made at an EV/EBITDA multiple between 8 and 12.
Menzies Enterprise Value is 607.7m, and the adjusted expected EBITDA for 2021 is 78m. As no updated guidance is available for 2021 EBITDA, we considered the last 98m consensus and adapted it to 78m because of the pandemic’s future effects.
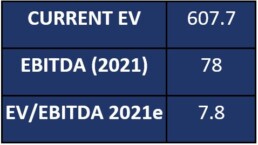
This is a sensitivity analysis considering the implied EV/EBITDA 2021 with Ebitda 2021e at 78m.

Valuations converge
As we have seen, the valuations of the different models for MNZS converge. We have taken the Earning Power Value, Discount cash Flow with its Sensitivity Analysis, and the EV/EBITDA ratio in the industry to conservatively approach the valuation.
We came up with a target price of 4.20 – 4.62 pounds per share with an upside potential of 76% – 94%.
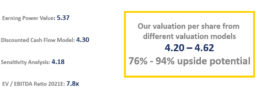
Dividends
In 2017 MNZS reported an EBITDA of 110 million, an EBIT of 78 million, and a Free Cash Flow per share of 9.7. The dividend yield for that year was 4.5%. The following year 2018, their EBITDA was 83 million, their EBIT was 55 million, and the Free Cash Flow per share was 13.7. The dividend yield for the year was again at 4.5%.
The free cash flow per share may be less in the future because of the higher current debt which served to finance recent acquisitions. The company might eventually decide not ti distribute a dividend. This, should not be considered a major concern as the investment thesis here is not the future stream of dividends. The value driver here is the recovery in air traffic and a return of Menzies to higher operating margins.
Risks
One of the most discussed risks that we see is in the industry itself. Some say that the travel sector could suffer permanent changes because of the COVID-19 pandemic. There are risks of disruption in corporate travels as remote working could be seen as a more productive and cost-efficient way of doing business. Still, leisure travel could also pick in the following months after the pandemic as the people are willing to visit relatives and explore the world after the long confinement.
Another risk lies in the stretched financial situation of the group. Although covenants on debt have been recently renegotiated, if the air traffic does not recover the company might face the challenge to pay back the debt. It could be forced to rely on a share capital increase (implying potential share capital dilution).
About Antonio Velardo
Antonio Velardo is an experienced Italian Venture Capitalist and options trader. He is an early Bitcoin and Ethereum adopter and evangelist who has grown his passion and knowledge after pursuing the Blockchain Strategy Programme at Oxford University and a Master’s degree in Digital Currency at Nicosia University.
Velardo manages an 8-figure portfolio of his investment company with a team of analysts; he is a sort of FinTweet mentor, people interact with him online, and he has more than 40,000 followers after his tweets. He has built a fortune in the great tech years and put together a tail strategy during the pandemic that allowed him to take advantage of the market drop. “I did not time the market, and I did not think this was even a black sworn,” he says.
On the side of the financial markets, Velardo has a unique combination. He was a real estate entrepreneur that developed several projects in Tunisia, Miami, Italy, the UK, and many other countries and cities. But he has always been passionate about options trading. Still, contrary to the volatility player and quant trading, he always had a value investing touch in his blood. Antonio studied Value Investing at Buffet’s famous business school at Columbia University. Even though the central concepts of value investing are antagonists to the venture capital pillars, Antonio’s approach tries to bridge elements of both worlds in order to seek alpha. Velardo has learned the importance of spotting pure growth stories and taking advantage of their S-Curve position. This is an essential element of Velardo’s approach as he looks forward to embracing great tech stories at the right time of the adoption cycle. This applies to stocks but also to blockchain projects.
A closer look at lightspeed POS
A company to keep into the radar although valuation looks stretched
BRIEF
- LSPD is a platform offering front-end consumer experience, back-end operations management, and a payment system.
- COVID-19 has dramatically increased the demand for the service as retailers rush to integrate online sales channels and payment systems.
- Well managed with a clear path to grow by scaling up dimensionally via M&A piggyback strategy.
- Valuation looks stretched for the time being but it’s worth looking at this company as its addressable market is huge. We would reconsider the story should the price fall back below $40 per share.
What is Lightspeed?
Lightspeed POS (TSE: LPSD / NYSE: LSPD) provides cloud-based point-of-sale and e-commerce software to restaurants, hospitality businesses, and retailers in over 100 countries. The platform’s three main pillars are the front-end consumer experience, back-end operations management, and the payment system. The company offers different services (SaaS) and hardware to run its software. They provide products for retailers like Point of sale, e-commerce, payment system, loyalty system, analytics, accounting, hardware (cashiers, scanners, printers, etc.), and other integrations.
Why did we look at the stock?
There have been certain movements related to this company. AMI Partners estimates that there are approximately 226 million small and medium-sized businesses (SMBs) around the world generating around $59 trillion of revenue in 2018. Lightspeed’s addressable market is huge and the firm is trying to consolidate the market by acquiring small operators and their client base.
Why do we believe it is overvalued?
LSPD valuation looks unsustainable under whatever metric we have tried to use. The stock is trading at around 35x P/Sales 2021E and 24x P/Sales 2022E. We understand that covid-19 has accelerated the digital transition for SMEs dramatically but, at current prices, we see more risks than upside on the story even if LSPD would continue to consolidate its market. Furthermore, we should factor in the potential dilution on equity (more likely at current prices as many growth companies are taking advantage to raise fresh money) on top of the difficulties in integrating targets being acquired. We would be keen to look at this interesting equity story once the price would fall below $40 per share.
Increased demand for services is an LPSD catalyst
It is hard for small and medium businesses to keep up with new developments in customer engagement, operation and channel management, and online payments. These kinds of retailers tend to look for modular services to keep updating their systems without incurring many complications. Lightspeed is also promising for data-driven solutions that are becoming critical for the businesses they serve. These services, as well as current and future artificial intelligence and other developments, are easy to integrate as new modules, driving further incremental revenue.
The demand for the service has dramatically increased due to the COVID-19 pandemic as retailers rush to integrate online sales channels and payment systems. However, Lightspeed’s churn rate has also increased because businesses like restaurants are suffering losses, and many have closed due to COVID-19’s impact on the real economy.
The company seems to be moving in the right direction when it comes to partnerships and acquisitions. Last February, they partnered with Stripe to add a payment module to Lightspeed’s services. This so far has represented a great strategy and a new revenue driver to the platform. Furthermore, in November, Dax Dasilva, Lightspeed’s CEO and founder announced the acquisition of ShoopKeep, a similar platform with more than 20,000 small and medium retailers in the USA. On December 1st, the company announced the acquisition of Upserve, a restaurant management cloud-software company that focuses on high-end restaurants, fast-casual, and bars.
Competitive position
The Point of Sales market is an old one and was once disrupted by offline software companies and now is being disrupted by internet-based companies.
Some Lightspeed competitors are:
- Square POS
- PayPal POS
- Heartland Retail
- Vend
- Clover
- Shopify POS
- QuickBooks POS
- Oracle Retail Xstore POS
The retail market is huge. There are approximately 226 million small and medium-sized businesses (SMBs) worldwide, generating around $59 trillion of revenue in 2018.
It is worth considering that there are a few limitations when it comes to small businesses. For instance, the price sensitivity for core software and equipment is something that the sector has to keep in mind to be able to compete. Lightspeed has very reasonable plans from just $69 to $259 per month for retailers and a starting package of $59 to $98 for restaurants. For that reason, the payment system was a good move as they entered the percentage game with much better outcomes possibilities for revenue.
Nevertheless, we are still searching for substantial competitive advantages as only a significant moat could assure the permanence and sustained growth of Lightspeed in the market in the long run. So far, we estimate that the switching costs could represent a medium barrier to entry to competitors.
Similar to what happens with legacy cashier systems (which are being disrupted by these internet companies), changing the software with which retailers manage their clients, operations, and payments could be more challenging and complicated than it seems.

The network effect and product ecosystem could play a role when it comes to multiple-store businesses but still weak in terms of a real barrier to entry. Notice that the company could enjoy an economy of scale advantage in the hardware segment. However, as it represents a small part of the company’s revenues and is not the core product, we do not think such a moat could be achieved soon. The same goes for the intangibles, it is a remote possibility, but the firm isn’t close to it yet.
Lastly, as we already know, the market is not particularly difficult for new players to enter. Virtually anyone could enter the market as the software and development of such services aren’t rocket science anymore, especially for banks and payments platforms.
Financials and business insights
We believe that the company is currently trading far above its fair price as the current valuation is overestimating the future increases in demand for their services due to the pandemic.
However, as we have said before, this pandemic was a catalyst for technology adoption. Still, the world was already moving in that direction, and it probably won’t go back when the COVID-19 is over. It doesn’t mean, though, that the company will keep its position for a long time. That will depend on other factors, particularly on the company’s ability to develop and maintain competitive advantages.
Lightspeed is a subscription-based company. We already discussed different ways to approach these firms in the report on FUBOTV that you can find on the blog. The difference with Lightspeed is that they tend to have more long-term subscriptions because of the LSPD business’s nature.
We have to look at unit economics when it comes to Lightspeed. Remember, the trick lies in obtaining the user, maintaining it, and monetizing it in different ways. Lightspeed has great potential in this last respect. For instance, the inclusion of the payment system mentioned before was a clear signal. In recent events, they have clarified some ideas about the future in this matter. Data-driven services are the management promise for future modules to be included in the list of services. With artificial intelligence and big-data development, we think that they are right-minded to state that.
Retailers, restaurants, and hotels greatly benefit from these technologies, and there is much more to come. They also have multiple-store customers’ added side effect, meaning that one customer could have separate accounts/users (one per store). It serves in both ways because the Customer Acquisition Cost for this kind of customer is divided by the number of its users/stores.
Suppose the management is able to strengthen its platform by including new modular services and that they can keep their clients happy, so the churn rate is controlled. In that case, the ARPU could keep growing in time. This could improve the Customer Lifetime Value and Customer Acquisition Cost Ratio, increasing Lightspeed’s profitability in the long term.
Before getting deeper into the company’s numbers, we have to state that to get clients in this market, you have to get new starting clients, disrupt existing retailers that use legacy systems, or steal them from competitors. None of these options are easy.
The number of users (or customer locations as they call them) has been systematically growing in the last years. The company currently has more than 80,000 users to be reported in the second quarter of 2021. A Year-To-Year growth of +40%, respecting in the same quarter of 2020.

The annual Average Revenue Per User increased by 15%, which is also a good indicator and helps with our theory of a medium barrier to entry regarding switching costs. Moreover, it also speaks about Lightspeed’s capacity to increase the revenue by selling new services to existing users.
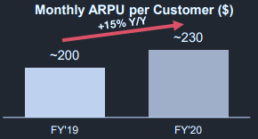
The primary revenue sources are the software (subscriptions to the different services) and the payment system (they charge 2.30% + 10/20/30 cents depending on the case). They also receive revenue from the hardware segment.
Our Valuation
We are basically repeating what we have done with FUBOTV equity story. Our goal is to find the Present value of each LSPD client. The valuation would probably be the present value of the existing and future clients’ cash flows.
For growth companies like LSPD, we continue repeating a basic concept: it is extremely difficult to have a reliable quantitative model because churn, inflation in service prices will most likely depend on the competition and on the company’s ability to scale up dimensionally.
The spreadsheet below is based on a client’s subscription base expected to grow at 26%CAGR over the 2021-30 period. We have assumed a 3% price increase, which we believe is reasonable given clients’ switching costs.
We have considered an EBITDA margin that turns positive in 2023 and stabilizes in 2030 at 50%. This means that from 2030 onward 50% of ARPU is transformed into EBITDA. This is a more than fair assumption as the business is low margin and furthermore, LSPD might incur additional costs related to the acquisitions it has done and it will do in the future.
The other key assumption we have made is that 70% of the Ebitda is converted into FCFE (Free cash flow to equity, residual to shareholders) which can finally be discounted at an appropriate cost of equity to figure out the equity value.
We have used a 9% cost of equity and a 3% perpetual growth rate. We could have done a more in-depth analysis of the beta and rely on a capital asset pricing model (CAPM). However, we believe it would not make much sense at this stage because the CAPM fails to deliver a reasonable cost of equity in cases like LSPD where basically the correlation to the index is limited as the company was listed last April.
So, in table 2 we have decided to rely on a sensitivity analysis which calculates the price per share by changing the cost of equity and the perpetual growth rate (g). Assuming a discount rate between 8% and 10% and a perpetual growth rate between 2.6% to 3.4%, the average price could be between $32 and $56 per share. The downside here is around 20%!
We have also checked the 2022 P/sales ratio implied by our sensitivity. In other words, still in table 2, we show for each equity value (or price per share) which is the implied 2022 P/sales. At current prices LSPD is trading around 35x P/Sales 2021E and 24x P/Sales 2022E. Our fair value range between $32 and $56 per share implies between 13x and 22.8x P/Sales 2022E.
In our view, there is evidence enough to consider LSPD overvalued: low margin business, low entry barrier, potential dilution on equity are all factors we have to take into consideration. If we were not in a pandemic scenario that is accelerating the digital transition, our valuation would have been even more conservative.
Spreadsheets
Table 1: DCF model

Table 2: Sensitivity analysis and 2022 implied P/E sales
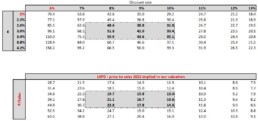
About Antonio Velardo
Antonio Velardo is an experienced Italian Venture Capitalist and options trader. He is an early Bitcoin and Ethereum adopter and evangelist who has grown his passion and knowledge after pursuing the Blockchain Strategy Programme at Oxford University and a Master’s degree in Digital Currency at Nicosia University.
Velardo manages an 8-figure portfolio of his investment company with a team of analysts; he is a sort of FinTweet mentor, people interact with him online, and he has more than 40,000 followers after his tweets. He has built a fortune in the great tech years and put together a tail strategy during the pandemic that allowed him to take advantage of the market drop. “I did not time the market, and I did not think this was even a black sworn,” he says.
On the side of the financial markets, Velardo has a unique combination. He was a real estate entrepreneur that developed several projects in Tunisia, Miami, Italy, the UK, and many other countries and cities. But he has always been passionate about options trading. Still, contrary to the volatility player and quant trading, he always had a value investing touch in his blood. Antonio studied Value Investing at Buffet’s famous business school at Columbia University. Even though the central concepts of value investing are antagonists to the venture capital pillars, Antonio’s approach tries to bridge elements of both worlds in order to seek alpha. Velardo has learned the importance of spotting pure growth stories and taking advantage of their S-Curve position. This is an essential element of Velardo’s approach as he looks forward to embracing great tech stories at the right time of the adoption cycle. This applies to stocks but also to blockchain projects.
Approaching subscription companies - Case: FUBOTV INC
Investment summary
- Streaming platform representing a cable-cutting alternative
- Well managed with a clear path to growth on core business
- Opportunities to diversify revenue stream
- Interesting valuation with high potential upside
What is FUBOTV
FUBOTV INC (NYSE: FUBO currently 27.40 $ per share as of December 3, 2020) is a streaming platform focused primarily on live sports. It is a cable-cutting alternative, especially for those who watch various sports channels and don’t want to miss any game, some of them in 4K.
The basic plan, which allows two simultaneous users, includes 100+ channels (more than 24 sports channels), 30 hours of cloud-based DVR for a monthly price of $59.99, and the “Fubo Extra” for $5.99 to add 44 more channels. Like cable TV, they offer several subscription plans, add-ons, and extras. FUBOTV’s interface is friendly but also similar to the cable TV ones. As you would imagine, it can be streamed through smart TVs, mobile, tablets, several devices like AppleTV, Chromecast, Amazon Fire, Roku, Xbox, and on the internet.
The sector is being reshaped
The sector is crowded by cable providers and by a plethora of streaming platforms. But the competitive hedge in the sector is being shifted and competition is not anymore on prices. The focus is now on quality, accessibility, interface, scalability, and contents. Streaming platforms are killing cable tv. At a certain stage we believe streaming platforms will tend to merge to benefit from economies of scale and keep up ARPU. M&A wave might be a major value driver in the sector although its still too early to factor it into current sector multiples. Furthermore, streaming platforms have great opportunities to diversify their revenue stream by increasing advertising (a linear function of the number of users) ecommerce and betting (see recent FUBOTV deal with Balto sports).
Where the upside may lie
FUBOTV is scaling up dimensionally very fast and is expected to keep growing not only on its traditional subscription business but also by expanding into gaming, betting and ecommerce. FUBOTV management is doing the right steps and if FUBOTV’s strategy proves to be effective, there is a substantial upside on this equity story as it is currently trading at 4x P/sales 2021 while it could converge to 8x (peers trading also at 11x) which would be in line with our FCFE model (Ebitda margin stabilized at 70% from 2025 onward, 70% EBTDA to FCFE conversion, 12% cost equity, 3% g).
FUBOTV: the sector and the competitive hedge
The sector is crowded by a plethora of competitors, some of which are not publicly traded for the time being. We believe although that, given current valuation metrics, some might soon considering going public.
DAZN:
English sports streaming service available in the USA, Austria, Brazil, Canada, Germany, Italy, Japan, Spain, and Switzerland. They are expected to go globally for more than 200 countries by December 1st, 2020. We are paying attention to this one because we believe it might be a real threat to FUBOTV.
Hulu:
Streaming service majority-owned by Disney. At the time, it has more than 36 million users. Even though it isn’t primarily focused on sports, it has all the local and national sports channels. For instance, their clients’ value is said to be $6,000, while for FUBOTV, we are being much more conservatives and calculate a customer value of around $550.
YouTube TV:
Features outstanding sports coverage, and like FUBOTV, it is a cable-replacement service. The prices are very similar to the ones of FUBOTV. It also has excellent cloud-based DVR capabilities.
Of course, FUBOTV also competes directly with cable providers. They have been around for a reasonable amount of time and are still important. However, the sector is being reshaped, and they are not competing anymore on prices. The focus is now on quality, accessibility, interface, scalability, and contents.
Opportunities ahead
Besides the regular expectations of more premium paid contents, like important hosted events, we think that there are good opportunities in two major segments:
Advertising
There is room for advertising growth on FUBOTV. As the number of customers grows, the capabilities of selling ads on the platform increase exponentially. Some extra features and metrics like CPC and CPA that online advertisers love must be taken into consideration.
Betting and Ecommerce
FaceBank’s eCommerce and payment system platform allows FUBOTV to penetrate the betting market. The recent acquisition of Balto sports (terms not disclosed) proves that the betting market is another excellent opportunity. Sports and betting go hand to hand very well, and online betting platforms like Draftkings keep growing. FUBOTV’s CEO David Glandler, an expert in the market, declared that they are looking forward to exploiting these opportunities in the future.
Financial overview & some insights
The company has greatly benefited from the COVID-19 situation, reaching an all-time high number of paid-subscribers of 455k+ in Q3 2020, increasing 58% to the same period of last year. The revenues were $61.2mln, an increase of 47% year-over-year. Subscription revenue increased 64% YoY to $53.4 mln, and advertising revenue increased an impressive 153% YoY to $7.5 mln.
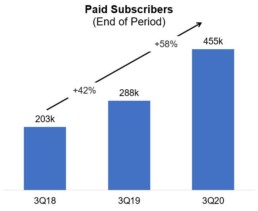
The average revenue per user (ARPU) increased 14% year-over-year, giving an excellent insight into the users’ price sensitivity. The company was able to increase the price and keep its users even though they raised the different plans’ prices.
In the first and second quarter of 2020, the revenues were $51mln and $44.2mln. The YoY increase was 78% for Q1 and 51% for Q2. The management for the last quarter of the year looks forward to a 60% year-over-year increase, which means $80-$85mln in revenues.
|
2020 |
||||||
|
1Q |
YoY % | 2Q | YoY % | 3Q |
YoY % |
|
| Total revenues | $ 51.0 | +78% | $ 44.2 | +53% | $ 61.2 | +47% |
| Subscription | $ 46.4 | +74% | $ 39.5 | +51% | $ 53.4 | +64% |
| Advertising | $ 4.1 | +120% | $ 4.3 | +71% | $ 7.5 | +153% |
Source: Company financial reports
FUBOTV’s number of paid subscribers has also been growing along with the Average Revenue Per User (ARPU). Most of these users are probably migrating from the “old model” of cable TV which is being disrupted.
|
2020 |
||||||
|
1Q |
YoY % | 2Q | YoY % | 3Q |
YoY % |
|
| Paid subscribers | 287,316 | +37% | 286,126 | +47% | 455,000 | +58% |
| ARPU | $54.16 | +25% | $54.79 | +8% | $67.70 | +14% |
| Total content hours | 107.2 million | +120% | 98.6 million | +83% | 133.3 million | +83% |
| MAUs | 120 hours | +52% | 140 hours | +54% | 121 hours | +20% |
Source: Company financial reports
ARPU: Average Revenue Per User
MAUs: Monthly Active User’s average number of consumed content (hours).
Key concepts to approach subscription-based companies
FaceBank and FUBOTV closed a merger agreement that seeks to enhance FUBOTV’s offering by combining FaceBank’s global e-commerce and payment platform and its technology-driven IP in sports, movies, and live performances with FUBOTV’s platform. This merger was a good move for the future possibilities of FUBOTV of getting into the betting market.
This kind of companies should not be compared to “old economy” firms. One of the main characteristics of subscription-based businesses is that it generates recurrent income by its customers as long as they are subscribed. We have to look at this companies as we would do for Netflix, for instance.
We first have to understand that the metrics of the company change accordingly to the company’s stage. The most successful the company is in acquiring new customers, the biggest will be the losses at the beginning. However, the customer acquisition cost (CAC) will generate revenue that will be kept for a certain length of time.
The happier the customer, the longer it will stay subscribed, and therefore it will be more valuable for the firm. So, having satisfied clients is translated into having a better customer lifetime value (CLV).
Once clear that traditional metrics to value a company are not taken into consideration when it comes to subscription-based firms we have to rely on some basic concepts:
Customer Churn Rate (CCR):
Churn rate is calculated by dividing the number of users at the beginning of a period less the number of users at the end of the same period by the number of users the beginning of the period. So, it is the rate that calculates how many users abandon the service in a certain period.
Customer Lifetime Value (CLV):
It is the Average Revenue Per User (ARPU) by the Customer Churn Rate (CCR). It measures how long the client stays with the service and how much revenue it provides.
Customer Acquisition Cost (CAC):
It measures the cost to acquire a user. CAC is equal to the total sales and marketing expenses divided by the number of new customers added. The expenses must be just the ones used to attract new clients, and promotions for current users must be excluded.
CLV:CAC ratio:
The relationship between the Customer Lifetime Value and the Customer Acquisition Cost is usually referred to as the “CLV:CAC ratio.” This is one of the most important metrics for subscription-based companies when it comes to profitability.
At the beginning, like all growth companies, we need to be very careful when looking at the Research and Development costs because they will be placed in the GAAP accounting. However, those intangibles will be capitalized over time. For FUBOTV, FaceBank, and Balto Sports are actually future drivers of value and contribute to the acquisition, retention, and monetization of users.
The concept of unit economics commonly englobes these indicators and others related to them. It looks directly at the revenues and costs associated with the firm’s business model. The concept is used for the projections of the company’s profitability. In subscription-based companies, the basic units are the subscribers.
ECLV ratio:
As you could imagine, to value FUBOTV, we will also need to calculate the expected customer lifetime value or “ECLV.” Under the assumption that the ARPU will be constant, we can say that the ECLV is the average return per user multiplied by the customer lifetime. ECLV = ARPU * CL
On the other hand, if we assume that the churn rate remains equal over time, the ECVL could be equal to the ARPU divided by the CCR. ECVL = ARPU / CCR
How could the valuation be approached?
I think that one way to get a fair valuation would be by calculating the users’ present value. So we first need the Cash Flow Per User (CFPU) and a discount rate (r).
To calculate the present value of future users, we can use:
Notice that we will need to subtract the cost of acquiring those clients at the end of the equation. Then to calculate the present value of current users, we would use the same without that last part:
We are going to apply these concepts in our approach to the valuation in a later stage.
Given the current stage of FUBOTV, we are unable to fully assess its churn rate. We first need to understand if the company could have a real moat. We do believe that strategic mergers and partnerships could increase the revenue of the firm. Nevertheless, until a competitive advantage is developed, their business model is under high risk as they might fail to grow, and the valuation would collapse.
Our valuation approach to FUBOTV
Our goal is to find the Present value of each FUBOTV client. The valuation would probably be the present value of the existing customers and future clients’ cash flow. Therefore, the concept of CAC (customer acquisition cost) and Churn Rate are essential to define, and they will have an impact on the company’s final valuation.
At this stage of the company’s life, attention needs to be put on the ability to retain the clients and keeping them because they can later switch to other platforms and therefore create tremendous damage to the valuation of the company. It all comes down to the moat.
It is extremely difficult to have a reliable quantitative model because Retention Rate and CAC will most likely depend on the competition. We believe indeed that the company’s effort would be to create a fantastic customer experience through acquisition. Still, if they fail to make a tremendous value experience for the clients, their business can be in danger.
The spreadsheet below is based on a client’s subsection that will have an annual compound growth rate. Initially, around 50% and then eventually will go down approximately 15%, which is very conservative. The same thing can be said about inflation. We have assumed a 3% price increase, which is again low as we consider that new competitors might lower prices or offer a better proposition trying to “steal” clients.
We have considered an EBITDA margin which starts negative and stabilizes in 2025 at 70%. This means that from 2025 onward 70% of ARPU is transformed into EBITDA. Some other subscription platforms can rely on higher margins. However, we believe 70% EBITDA margin at regimen is a very reasonable measure.
The other key assumption we have made is that 70% of the Ebitda is converted into FCFE (Free cash flow to equity, residual to shareholders) which can finally be discounted at an appropriate cost of equity to figure out the equity value.
We have used a 12% cost of equity and 3% perpetual growth rate. We could have done a more in-depth analysis of the beta and rely on a capital asset pricing model (CAPM). However, we believe it would not make much sense at this stage because the CAPM fails to deliver a reasonable cost of equity in cases like FUBOTV where basically the correlation to the index is limited as the company was recently listed.
So, we decided to rely on a sensitivity analysis which calculates the price per share by changing the cost of equity and the perpetual growth rate (g). Assuming a discount rate between 11% and 13% and a perpetual growth rate between of 2.6% to 3.4%, the average price could be between 55 and 69 $ per share. We would be confident in assessing a target price around $60 per share (current share price around $ 27 per share).
We have also checked the 2021 P/sales ratio implied by our sensitivity. In other words, in table 2 we show for each equity value (or price per share) which is the implied 2021 P/sales.
Currently FUBOTV is trading around 4x P/Sales 2021, very far from ROKU which is trading at a P/sales 2021around 12x.
In table 3, we show that at a P/Sales around 10x in any given year from 2021 to 2030, we come out with a market cap which, discounted to present at 12% cost of equity, delivers around $60 target price.
We are aware that our valuation relies on FUBOTV being able to scale up dimensionally vary fast. We are also aware that we have not set a timeframe to reach our valuation. We believe it is not the case because of the nature of the business and the stage of the company.
However, we believe there is evidence enough to consider FUBOTV as a growth company with an interesting potential upside which could find room in a portfolio of any smart investor focused on growth. We will update the valuation according to the news flow. STAY TUNED!
Spreadsheets
Table 1: DCF model

Source: Antonio Velardo personal elaboration
Table 2: Sensitivity analysis and 2021 implied P/E sales
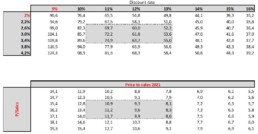
Source: Antonio Velardo personal elaboration
Table 3: P/E sales implied by our FCFF DCF model
Source: Antonio Velardo personal elaboration
About Antonio Velardo
Antonio Velardo is an experienced Italian Venture Capitalist and options trader. He is an early Bitcoin and Ethereum adopter and evangelist who has grown his passion and knowledge after pursuing the Blockchain Strategy Programme at Oxford University and a Master’s degree in Digital Currency at Nicosia University.
Velardo manages an 8-figure portfolio of his investment company with a team of analysts; he is a sort of FinTweet mentor, people interact with him online, and he has more than 40,000 followers after his tweets. He has built a fortune in the great tech years and put together a tail strategy during the pandemic that allowed him to take advantage of the market drop. “I did not time the market, and I did not think this was even a black sworn,” he says.
On the side of the financial markets, Velardo has a unique combination. He was a real estate entrepreneur that developed several projects in Tunisia, Miami, Italy, the UK, and many other countries and cities. But he has always been passionate about options trading. Still, contrary to the volatility player and quant trading, he always had a value investing touch in his blood. Antonio studied Value Investing at Buffet’s famous business school at Columbia University. Even though the central concepts of value investing are antagonists to the venture capital pillars, Antonio’s approach tries to bridge elements of both worlds in order to seek alpha. Velardo has learned the importance of spotting pure growth stories and taking advantage of their S-Curve position. This is an essential element of Velardo’s approach as he looks forward to embracing great tech stories at the right time of the adoption cycle. This applies to stocks but also to blockchain projects.


